注意
前往結尾下載完整範例程式碼。或透過 Binder 在您的瀏覽器中執行此範例
與 3D 影像(腎臟組織)互動#
在本教學中,我們將互動式探索一個具有三個空間維度和三個色彩維度(通道)的生物醫學影像。如需 3D 影像處理的一般介紹,請參閱探索 3D 影像(細胞)。我們在這裡使用的資料對應於使用共焦螢光顯微鏡成像的腎臟組織(更多詳細資訊請參閱 [1] 在 kidney-tissue-fluorescence.tif 下)。
import matplotlib.pyplot as plt
import numpy as np

import plotly
import plotly.express as px
from skimage import data
載入影像#
此生物醫學影像可透過 scikit-image 的資料登錄取得。
data = data.kidney()
傳回的資料集是 3D 多通道影像
print(f'number of dimensions: {data.ndim}')
print(f'shape: {data.shape}')
print(f'dtype: {data.dtype}')
number of dimensions: 4
shape: (16, 512, 512, 3)
dtype: uint16
維度以以下順序提供:(z, y, x, c),即 [平面, 列, 欄, 通道]。
n_plane, n_row, n_col, n_chan = data.shape
現在,我們只考慮資料的一個切片(2D 平面)。更具體來說,讓我們考慮位於堆疊中間的切片。imshow 函式可以顯示灰階和 RGB(A) 2D 影像。
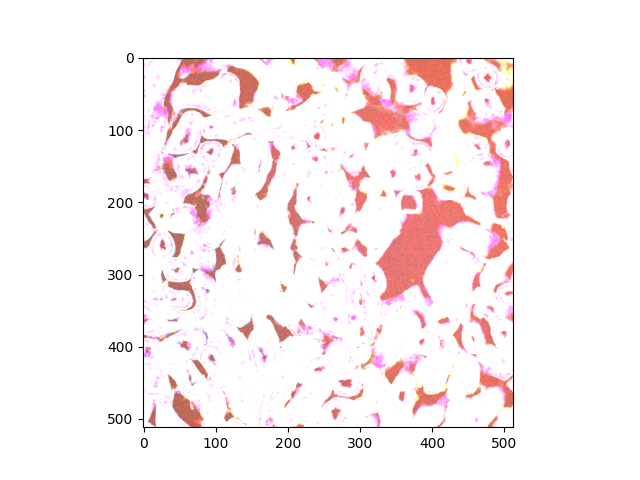
Clipping input data to the valid range for imshow with RGB data ([0..1] for floats or [0..255] for integers). Got range [64..4095].

<matplotlib.image.AxesImage object at 0x7fb7a0a61e50>
根據警告訊息,值的範圍是出乎意料的。影像的渲染在色彩方面顯然不令人滿意。
range: (10, 4095)
我們轉向 Plotly 的 plotly.express.imshow() 函式實作,因為它支援超出浮點數的 (0.0, 1.0) 和整數的 (0, 255) 的值範圍。
這就是您要的,螢光顯微鏡!
正規化每個通道的範圍#
一般來說,我們可能希望在每個通道的基礎上正規化值範圍。讓我們沿著通道軸將資料(切片)分面。這樣,我們得到三個單通道影像,其中使用每個影像的最大值
每個色彩通道的值範圍是多少?我們透過取所有非通道軸的最小值和最大值來檢查。
range for channel 0: (10, 4095)
range for channel 1: (68, 4095)
range for channel 2: (35, 4095)
讓我們非常具體,並在每個通道的基礎上傳遞值範圍
Plotly 讓您透過平移、放大和縮小以及將所需的圖形匯出為 PNG 格式的靜態影像來與此視覺化互動。
以動畫幀的形式探索切片#
按一下播放按鈕,沿著 z 軸移動,穿過所有 16 個切片的堆疊。
合併通道分面和切片動畫#
fig = px.imshow(
    data,
    animation_frame=0,
    facet_col=3,
    binary_string=True,
    labels={'facet_col': 'channel', 'animation_frame': 'plane'},
)
plotly.io.show(fig)
生物學家的眼睛可以看到兩個亮點(在 通道=2 中最明顯)是腎臟腎小球 [2]。
plt.show()
腳本總執行時間: (0 分鐘 14.496 秒)