注意
跳至結尾以下載完整的範例程式碼。或透過 Binder 在您的瀏覽器中執行此範例
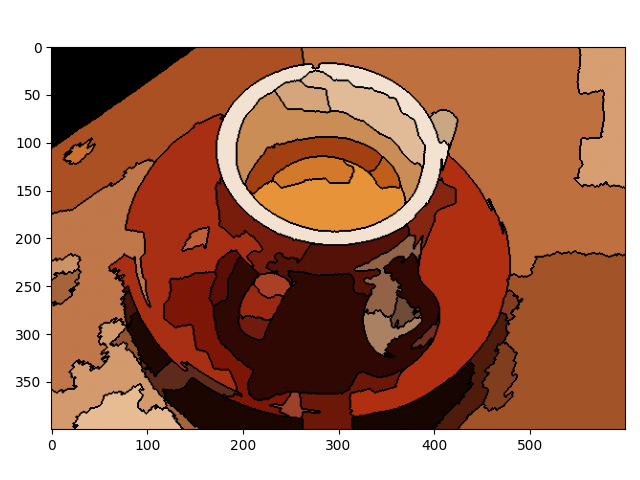
區域鄰接圖 (RAG) 合併#
此範例會建構一個區域鄰接圖 (RAG),並逐步合併顏色相似的區域。合併兩個相鄰區域會產生一個新的區域,其中包含來自合併區域的所有像素。合併區域直到不再有高度相似的區域對為止。
from skimage import data, segmentation, color
from skimage import graph
import numpy as np
import matplotlib.pyplot as plt


def _weight_mean_color(graph, src, dst, n):
    """Callback to handle merging nodes by recomputing mean color.

    The method expects that the mean color of `dst` is already computed.

    Parameters
    ----------
    graph : RAG
        The graph under consideration.
    src, dst : int
        The vertices in `graph` to be merged.
    n : int
        A neighbor of `src` or `dst` or both.

    Returns
    -------
    data : dict
        A dictionary with the `"weight"` attribute set as the absolute
        difference of the mean color between node `dst` and `n`.
    """

    diff = graph.nodes[dst]['mean color'] - graph.nodes[n]['mean color']
    diff = np.linalg.norm(diff)
    return {'weight': diff}


def merge_mean_color(graph, src, dst):
    """Callback called before merging two nodes of a mean color distance graph.

    This method computes the mean color of `dst`.

    Parameters
    ----------
    graph : RAG
        The graph under consideration.
    src, dst : int
        The vertices in `graph` to be merged.
    """
    graph.nodes[dst]['total color'] += graph.nodes[src]['total color']
    graph.nodes[dst]['pixel count'] += graph.nodes[src]['pixel count']
    graph.nodes[dst]['mean color'] = (
        graph.nodes[dst]['total color'] / graph.nodes[dst]['pixel count']
    )


img = data.coffee()
labels = segmentation.slic(img, compactness=30, n_segments=400, start_label=1)
g = graph.rag_mean_color(img, labels)

labels2 = graph.merge_hierarchical(
    labels,
    g,
    thresh=35,
    rag_copy=False,
    in_place_merge=True,
    merge_func=merge_mean_color,
    weight_func=_weight_mean_color,
)

out = color.label2rgb(labels2, img, kind='avg', bg_label=0)
out = segmentation.mark_boundaries(out, labels2, (0, 0, 0))

fig, ax = plt.subplots()
ax.imshow(out)
plt.tight_layout()
plt.show()
腳本總執行時間: (0 分鐘 4.305 秒)