注意
前往結尾以下載完整的範例程式碼。或透過 Binder 在您的瀏覽器中執行此範例
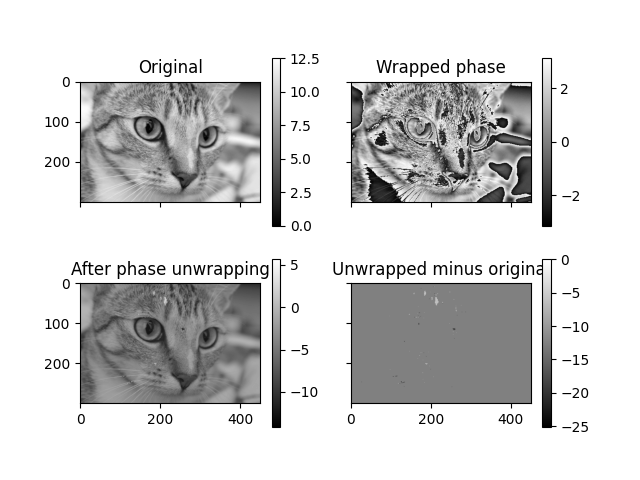
相位展開#
某些訊號只能觀察到模數為 2*pi 的結果,這也適用於二維和三維影像。在這些情況下,需要進行相位展開以恢復底層未展開的訊號。在此範例中,我們將展示一個[1]中實作的演算法,該演算法用於此類問題。skimage可以使用 skimage 展開一維、二維和三維影像。在這裡,我們將展示二維情況下的相位展開。
import numpy as np
from matplotlib import pyplot as plt
from skimage import data, img_as_float, color, exposure
from skimage.restoration import unwrap_phase


# Load an image as a floating-point grayscale
image = color.rgb2gray(img_as_float(data.chelsea()))
# Scale the image to [0, 4*pi]
image = exposure.rescale_intensity(image, out_range=(0, 4 * np.pi))
# Create a phase-wrapped image in the interval [-pi, pi)
image_wrapped = np.angle(np.exp(1j * image))
# Perform phase unwrapping
image_unwrapped = unwrap_phase(image_wrapped)

fig, ax = plt.subplots(2, 2, sharex=True, sharey=True)
ax1, ax2, ax3, ax4 = ax.ravel()

fig.colorbar(ax1.imshow(image, cmap='gray', vmin=0, vmax=4 * np.pi), ax=ax1)
ax1.set_title('Original')

fig.colorbar(ax2.imshow(image_wrapped, cmap='gray', vmin=-np.pi, vmax=np.pi), ax=ax2)
ax2.set_title('Wrapped phase')

fig.colorbar(ax3.imshow(image_unwrapped, cmap='gray'), ax=ax3)
ax3.set_title('After phase unwrapping')

fig.colorbar(ax4.imshow(image_unwrapped - image, cmap='gray'), ax=ax4)
ax4.set_title('Unwrapped minus original')
Text(0.5, 1.0, 'Unwrapped minus original')
展開程序接受遮罩陣列,並且還可以選擇性地假設循環邊界來連接影像的邊緣。在下面的範例中,我們研究一個簡單的相位斜坡,該斜坡透過遮罩影像的一行來分割成兩部分。
# Create a simple ramp
image = np.ones((100, 100)) * np.linspace(0, 8 * np.pi, 100).reshape((-1, 1))
# Mask the image to split it in two horizontally
mask = np.zeros_like(image, dtype=bool)
mask[image.shape[0] // 2, :] = True

image_wrapped = np.ma.array(np.angle(np.exp(1j * image)), mask=mask)
# Unwrap image without wrap around
image_unwrapped_no_wrap_around = unwrap_phase(image_wrapped, wrap_around=(False, False))
# Unwrap with wrap around enabled for the 0th dimension
image_unwrapped_wrap_around = unwrap_phase(image_wrapped, wrap_around=(True, False))

fig, ax = plt.subplots(2, 2)
ax1, ax2, ax3, ax4 = ax.ravel()

fig.colorbar(ax1.imshow(np.ma.array(image, mask=mask), cmap='rainbow'), ax=ax1)
ax1.set_title('Original')

fig.colorbar(ax2.imshow(image_wrapped, cmap='rainbow', vmin=-np.pi, vmax=np.pi), ax=ax2)
ax2.set_title('Wrapped phase')

fig.colorbar(ax3.imshow(image_unwrapped_no_wrap_around, cmap='rainbow'), ax=ax3)
ax3.set_title('Unwrapped without wrap_around')

fig.colorbar(ax4.imshow(image_unwrapped_wrap_around, cmap='rainbow'), ax=ax4)
ax4.set_title('Unwrapped with wrap_around')

plt.tight_layout()
plt.show()
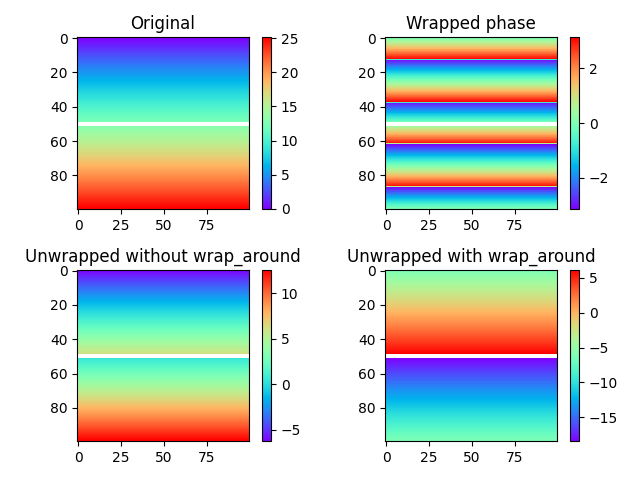
在上面的圖中,遮罩行可以看作是穿過影像的白色線條。底列中兩個展開影像之間的差異很明顯:在沒有展開的情況下(左下),遮罩邊界上方和下方的區域根本沒有互動,導致兩個區域之間產生任意整數乘以 2 pi 的偏移量。我們也可以將這些區域展開為兩個單獨的影像。在垂直方向啟用環繞的情況下(右下),情況發生了變化:現在允許展開路徑從影像的底部傳遞到頂部,反之亦然,從而提供了一種確定兩個區域之間偏移量的方法。
參考文獻#
腳本的總執行時間: (0 分鐘 1.315 秒)