注意
前往結尾下載完整範例程式碼。或透過 Binder 在您的瀏覽器中執行此範例
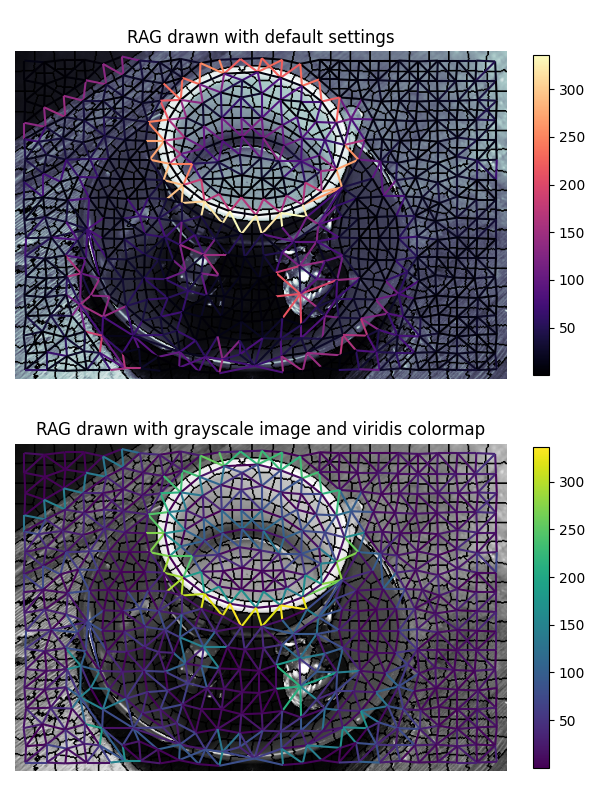
繪製區域鄰接圖 (RAG)#
此範例建構一個區域鄰接圖 (RAG),並使用 rag_draw 方法繪製它。
from skimage import data, segmentation
from skimage import graph
from matplotlib import pyplot as plt


img = data.coffee()
labels = segmentation.slic(img, compactness=30, n_segments=400, start_label=1)
g = graph.rag_mean_color(img, labels)

fig, ax = plt.subplots(nrows=2, sharex=True, sharey=True, figsize=(6, 8))

ax[0].set_title('RAG drawn with default settings')
lc = graph.show_rag(labels, g, img, ax=ax[0])
# specify the fraction of the plot area that will be used to draw the colorbar
fig.colorbar(lc, fraction=0.03, ax=ax[0])

ax[1].set_title('RAG drawn with grayscale image and viridis colormap')
lc = graph.show_rag(labels, g, img, img_cmap='gray', edge_cmap='viridis', ax=ax[1])
fig.colorbar(lc, fraction=0.03, ax=ax[1])

for a in ax:
    a.axis('off')

plt.tight_layout()
plt.show()
腳本的總執行時間: (0 分鐘 4.503 秒)