注意
跳到結尾下載完整範例程式碼。或透過 Binder 在您的瀏覽器中執行此範例
測量區域屬性#
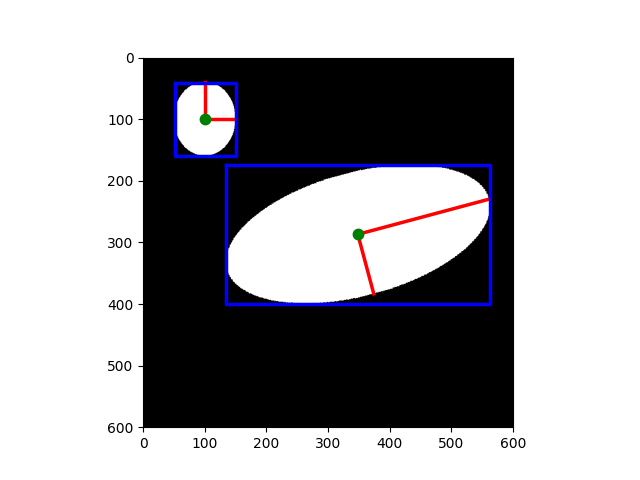
此範例示範如何測量標記影像區域的屬性。我們首先分析一個具有兩個橢圓的影像。下面我們將展示如何互動式地探索標記物體的屬性。
import math
import matplotlib.pyplot as plt
import numpy as np
import pandas as pd

from skimage.draw import ellipse
from skimage.measure import label, regionprops, regionprops_table
from skimage.transform import rotate


image = np.zeros((600, 600))

rr, cc = ellipse(300, 350, 100, 220)
image[rr, cc] = 1

image = rotate(image, angle=15, order=0)

rr, cc = ellipse(100, 100, 60, 50)
image[rr, cc] = 1

label_img = label(image)
regions = regionprops(label_img)
我們使用 skimage.measure.regionprops() 的結果在每個區域上繪製特定屬性。例如,以紅色繪製每個橢圓的長軸和短軸。
fig, ax = plt.subplots()
ax.imshow(image, cmap=plt.cm.gray)

for props in regions:
    y0, x0 = props.centroid
    orientation = props.orientation
    x1 = x0 + math.cos(orientation) * 0.5 * props.axis_minor_length
    y1 = y0 - math.sin(orientation) * 0.5 * props.axis_minor_length
    x2 = x0 - math.sin(orientation) * 0.5 * props.axis_major_length
    y2 = y0 - math.cos(orientation) * 0.5 * props.axis_major_length

    ax.plot((x0, x1), (y0, y1), '-r', linewidth=2.5)
    ax.plot((x0, x2), (y0, y2), '-r', linewidth=2.5)
    ax.plot(x0, y0, '.g', markersize=15)

    minr, minc, maxr, maxc = props.bbox
    bx = (minc, maxc, maxc, minc, minc)
    by = (minr, minr, maxr, maxr, minr)
    ax.plot(bx, by, '-b', linewidth=2.5)

ax.axis((0, 600, 600, 0))
plt.show()
我們使用 skimage.measure.regionprops_table() 函數來計算每個區域的(選定)屬性。請注意,skimage.measure.regionprops_table 實際上會計算屬性,而 skimage.measure.regionprops 則會在用到它們時才計算(惰性求值)。
props = regionprops_table(
    label_img,
    properties=('centroid', 'orientation', 'axis_major_length', 'axis_minor_length'),
)
我們現在顯示這些選定屬性的表格(每行一個區域),skimage.measure.regionprops_table 的結果是一個與 pandas 相容的字典。
pd.DataFrame(props)
也可以透過視覺化標籤的懸停資訊來互動式地探索標記物體的屬性。此範例使用 plotly 來顯示滑鼠懸停在物件上時的屬性。
import plotly
import plotly.express as px
import plotly.graph_objects as go
from skimage import data, filters, measure, morphology

img = data.coins()
# Binary image, post-process the binary mask and compute labels
threshold = filters.threshold_otsu(img)
mask = img > threshold
mask = morphology.remove_small_objects(mask, 50)
mask = morphology.remove_small_holes(mask, 50)
labels = measure.label(mask)

fig = px.imshow(img, binary_string=True)
fig.update_traces(hoverinfo='skip')  # hover is only for label info

props = measure.regionprops(labels, img)
properties = ['area', 'eccentricity', 'perimeter', 'intensity_mean']

# For each label, add a filled scatter trace for its contour,
# and display the properties of the label in the hover of this trace.
for index in range(1, labels.max()):
    label_i = props[index].label
    contour = measure.find_contours(labels == label_i, 0.5)[0]
    y, x = contour.T
    hoverinfo = ''
    for prop_name in properties:
        hoverinfo += f'<b>{prop_name}: {getattr(props[index], prop_name):.2f}</b><br>'
    fig.add_trace(
        go.Scatter(
            x=x,
            y=y,
            name=label_i,
            mode='lines',
            fill='toself',
            showlegend=False,
            hovertemplate=hoverinfo,
            hoveron='points+fills',
        )
    )

plotly.io.show(fig)
腳本的總執行時間:(0 分鐘 1.607 秒)