注意
前往結尾下載完整的範例程式碼。或透過 Binder 在您的瀏覽器中執行此範例
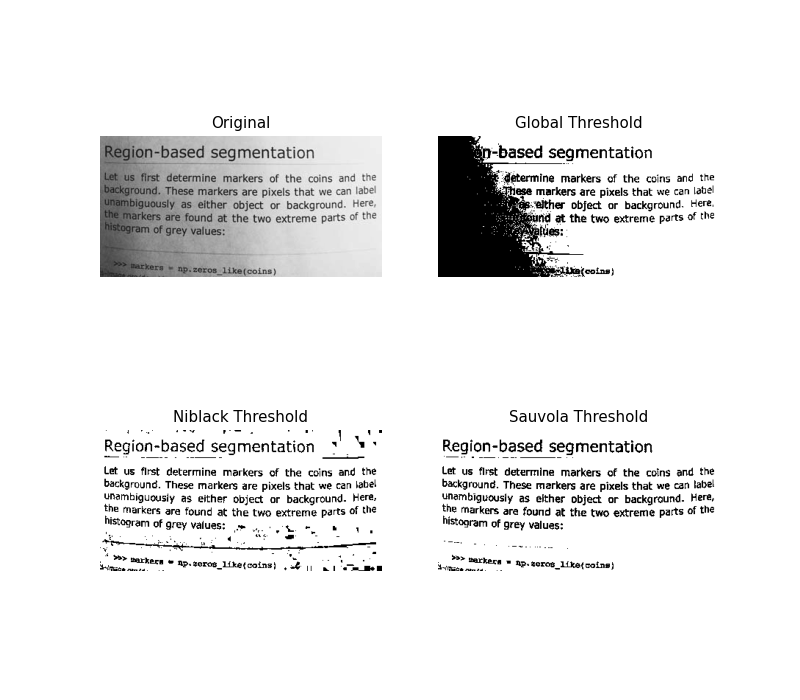
Niblack 和 Sauvola 閾值化#
Niblack 和 Sauvola 閾值是局部閾值化技術,適用於背景不均勻的影像,特別是文字辨識 [1]、 [2]。它不是為整個影像計算單個全域閾值,而是透過使用特定的公式為每個像素計算幾個閾值,這些公式考慮到局部鄰域(由以像素為中心的視窗定義)的平均值和標準差。
在這裡,我們使用這些演算法對影像進行二值化,並將其與常見的全域閾值化技術進行比較。參數 window_size 決定包含周圍像素的視窗大小。
import matplotlib
import matplotlib.pyplot as plt

from skimage.data import page
from skimage.filters import threshold_otsu, threshold_niblack, threshold_sauvola


matplotlib.rcParams['font.size'] = 9


image = page()
binary_global = image > threshold_otsu(image)

window_size = 25
thresh_niblack = threshold_niblack(image, window_size=window_size, k=0.8)
thresh_sauvola = threshold_sauvola(image, window_size=window_size)

binary_niblack = image > thresh_niblack
binary_sauvola = image > thresh_sauvola

plt.figure(figsize=(8, 7))
plt.subplot(2, 2, 1)
plt.imshow(image, cmap=plt.cm.gray)
plt.title('Original')
plt.axis('off')

plt.subplot(2, 2, 2)
plt.title('Global Threshold')
plt.imshow(binary_global, cmap=plt.cm.gray)
plt.axis('off')

plt.subplot(2, 2, 3)
plt.imshow(binary_niblack, cmap=plt.cm.gray)
plt.title('Niblack Threshold')
plt.axis('off')

plt.subplot(2, 2, 4)
plt.imshow(binary_sauvola, cmap=plt.cm.gray)
plt.title('Sauvola Threshold')
plt.axis('off')

plt.show()
腳本的總執行時間: (0 分鐘 0.347 秒)