注意
前往結尾以下載完整範例程式碼。或透過 Binder 在您的瀏覽器中執行此範例
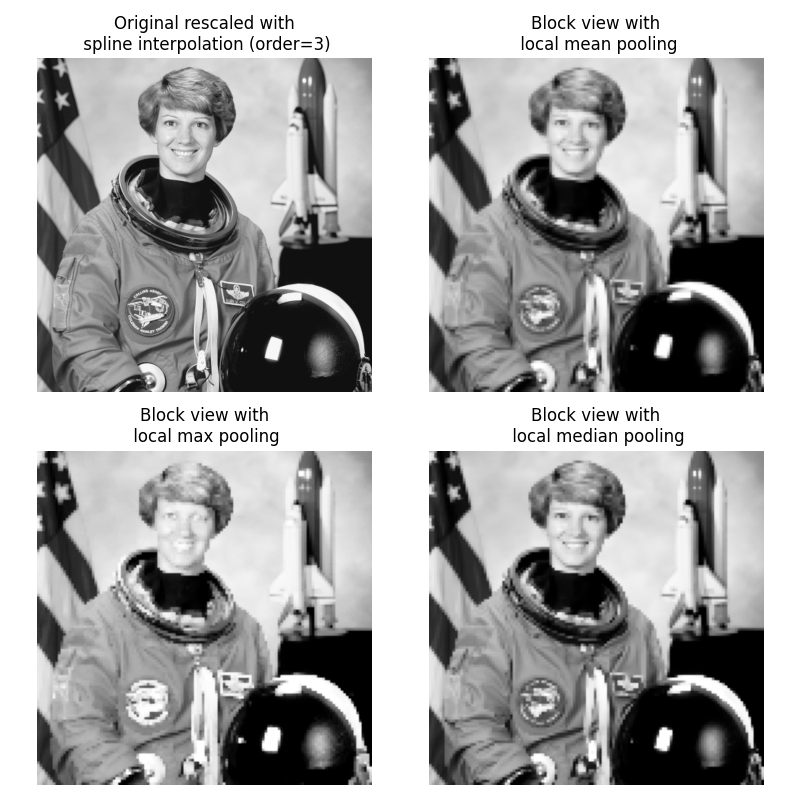
影像/陣列上的區塊視圖#
此範例說明了 skimage.util() 中的 view_as_blocks 的使用。當您想要在非重疊的影像塊上執行局部操作時,區塊視圖非常有用。
我們使用 skimage.data 中的 astronaut,並將其虛擬「切片」成正方形區塊。然後,在每個區塊上,我們要麼匯總該區塊的平均值、最大值或中位數。結果會與原始 astronaut 影像的三階樣條插值重新縮放一起顯示。
import numpy as np
from scipy import ndimage as ndi
from matplotlib import pyplot as plt
import matplotlib.cm as cm

from skimage import data
from skimage import color
from skimage.util import view_as_blocks


# get astronaut from skimage.data in grayscale
l = color.rgb2gray(data.astronaut())

# size of blocks
block_shape = (4, 4)

# see astronaut as a matrix of blocks (of shape block_shape)
view = view_as_blocks(l, block_shape)

# collapse the last two dimensions in one
flatten_view = view.reshape(view.shape[0], view.shape[1], -1)

# resampling the image by taking either the `mean`,
# the `max` or the `median` value of each blocks.
mean_view = np.mean(flatten_view, axis=2)
max_view = np.max(flatten_view, axis=2)
median_view = np.median(flatten_view, axis=2)

# display resampled images
fig, axes = plt.subplots(2, 2, figsize=(8, 8), sharex=True, sharey=True)
ax = axes.ravel()

l_resized = ndi.zoom(l, 2, order=3)
ax[0].set_title("Original rescaled with\n spline interpolation (order=3)")
ax[0].imshow(l_resized, extent=(-0.5, 128.5, 128.5, -0.5), cmap=cm.Greys_r)

ax[1].set_title("Block view with\n local mean pooling")
ax[1].imshow(mean_view, cmap=cm.Greys_r)

ax[2].set_title("Block view with\n local max pooling")
ax[2].imshow(max_view, cmap=cm.Greys_r)

ax[3].set_title("Block view with\n local median pooling")
ax[3].imshow(median_view, cmap=cm.Greys_r)

for a in ax:
    a.set_axis_off()

fig.tight_layout()
plt.show()
腳本的總執行時間: (0 分鐘 0.919 秒)