注意
跳至結尾以下載完整的範例程式碼。或透過 Binder 在您的瀏覽器中執行此範例
Marching Cubes#
Marching Cubes 是一種從 3D 體積中提取 2D 表面網格的演算法。這可以概念化為地形圖或天氣圖上等值線的 3D 推廣。它藉由迭代掃描體積來工作,尋找跨越感興趣層級的區域。如果找到此類區域,則會產生三角剖分並將其添加到輸出網格。最終結果是一組頂點和一組三角形面。
該演算法需要一個資料體積和一個等值面值。例如,在 CT 成像中,+700 至 +3000 的豪斯菲爾德單位代表骨骼。因此,一個潛在的輸入將是重建的 CT 資料集和值 +700,以提取骨骼或類似骨骼密度的區域的網格。
此實作也透過使用 spacing kwarg 正確處理各向異性資料集,其中每個空間維度的體素間距不相等。
import numpy as np
import matplotlib.pyplot as plt
from mpl_toolkits.mplot3d.art3d import Poly3DCollection
from skimage import measure
from skimage.draw import ellipsoid
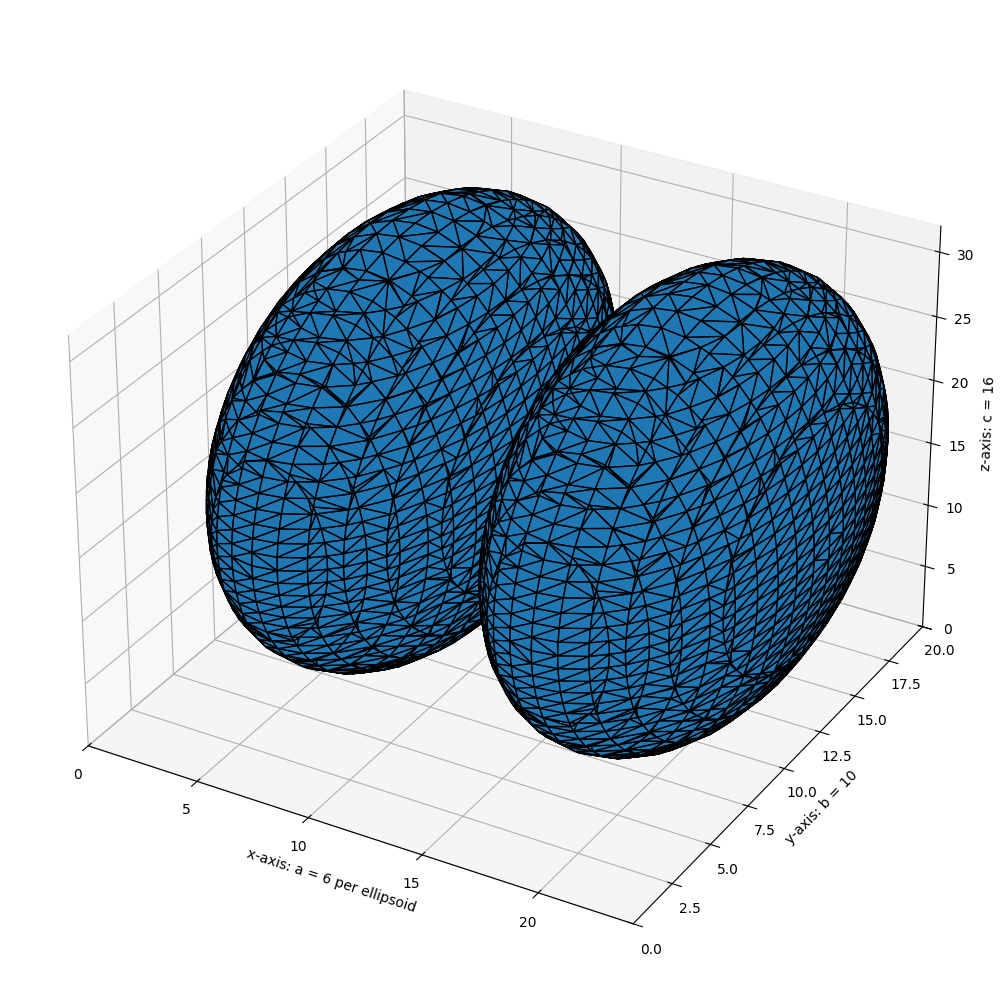
# Generate a level set about zero of two identical ellipsoids in 3D
ellip_base = ellipsoid(6, 10, 16, levelset=True)
ellip_double = np.concatenate((ellip_base[:-1, ...], ellip_base[2:, ...]), axis=0)
# Use marching cubes to obtain the surface mesh of these ellipsoids
verts, faces, normals, values = measure.marching_cubes(ellip_double, 0)
# Display resulting triangular mesh using Matplotlib. This can also be done
# with mayavi (see skimage.measure.marching_cubes docstring).
fig = plt.figure(figsize=(10, 10))
ax = fig.add_subplot(111, projection='3d')
# Fancy indexing: `verts[faces]` to generate a collection of triangles
mesh = Poly3DCollection(verts[faces])
mesh.set_edgecolor('k')
ax.add_collection3d(mesh)
ax.set_xlabel("x-axis: a = 6 per ellipsoid")
ax.set_ylabel("y-axis: b = 10")
ax.set_zlabel("z-axis: c = 16")
ax.set_xlim(0, 24) # a = 6 (times two for 2nd ellipsoid)
ax.set_ylim(0, 20) # b = 10
ax.set_zlim(0, 32) # c = 16
plt.tight_layout()
plt.show()
腳本的總執行時間: (0 分鐘 1.807 秒)