注意
前往結尾以下載完整的範例程式碼。或透過 Binder 在您的瀏覽器中執行此範例
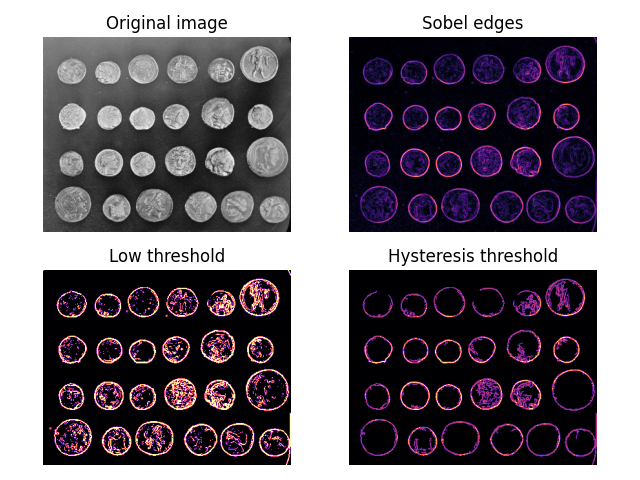
遲滯閾值處理#
遲滯是一種效果的延遲,一種慣性。在閾值處理的背景下,這表示如果某區域也連接到高於更高、更嚴格的閾值的區域,則視為高於某個較低閾值的區域。因此,它們可以被視為這些高信賴度區域的延續。
在下方,我們將一般閾值處理與遲滯閾值處理進行比較。請注意遲滯如何讓您忽略硬幣邊緣外的「雜訊」。
import matplotlib.pyplot as plt
from skimage import data, filters

fig, ax = plt.subplots(nrows=2, ncols=2)

image = data.coins()
edges = filters.sobel(image)

low = 0.1
high = 0.35

lowt = (edges > low).astype(int)
hight = (edges > high).astype(int)
hyst = filters.apply_hysteresis_threshold(edges, low, high)

ax[0, 0].imshow(image, cmap='gray')
ax[0, 0].set_title('Original image')

ax[0, 1].imshow(edges, cmap='magma')
ax[0, 1].set_title('Sobel edges')

ax[1, 0].imshow(lowt, cmap='magma')
ax[1, 0].set_title('Low threshold')

ax[1, 1].imshow(hight + hyst, cmap='magma')
ax[1, 1].set_title('Hysteresis threshold')

for a in ax.ravel():
    a.axis('off')

plt.tight_layout()

plt.show()
腳本總執行時間:(0 分鐘 0.651 秒)