注意
移至結尾以下載完整的範例程式碼。或者通過 Binder 在您的瀏覽器中運行此範例
多重 Otsu 閾值化#
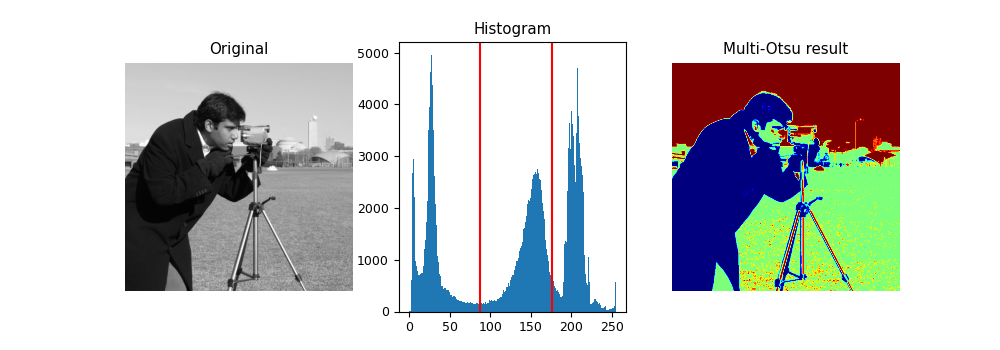
多重 Otsu 閾值 [1] 是一種閾值化演算法,用於將輸入影像的像素分成幾個不同的類別,每個類別都是根據影像內灰階的強度獲得的。
多重 Otsu 計算由所需類別數量確定的多個閾值。預設類別數為 3:為了獲得三個類別,演算法會傳回兩個閾值。它們在下面的直方圖中以紅色線表示。
import matplotlib
import matplotlib.pyplot as plt
import numpy as np

from skimage import data
from skimage.filters import threshold_multiotsu

# Setting the font size for all plots.
matplotlib.rcParams['font.size'] = 9

# The input image.
image = data.camera()

# Applying multi-Otsu threshold for the default value, generating
# three classes.
thresholds = threshold_multiotsu(image)

# Using the threshold values, we generate the three regions.
regions = np.digitize(image, bins=thresholds)

fig, ax = plt.subplots(nrows=1, ncols=3, figsize=(10, 3.5))

# Plotting the original image.
ax[0].imshow(image, cmap='gray')
ax[0].set_title('Original')
ax[0].axis('off')

# Plotting the histogram and the two thresholds obtained from
# multi-Otsu.
ax[1].hist(image.ravel(), bins=255)
ax[1].set_title('Histogram')
for thresh in thresholds:
    ax[1].axvline(thresh, color='r')

# Plotting the Multi Otsu result.
ax[2].imshow(regions, cmap='jet')
ax[2].set_title('Multi-Otsu result')
ax[2].axis('off')

plt.subplots_adjust()

plt.show()
腳本的總執行時間: (0 分鐘 0.714 秒)