注意
跳至結尾下載完整的範例程式碼。或透過 Binder 在您的瀏覽器中執行此範例
區域邊界 RAG 的階層式合併#
此範例示範如何在區域邊界區域鄰接圖 (RAG) 上執行階層式合併。可以使用 skimage.graph.rag_boundary() 函數建構區域邊界 RAG。具有最低邊緣權重的區域會依序合併,直到沒有權重小於 thresh 的邊緣。階層式合併是透過 skimage.graph.merge_hierarchical() 函數完成。如需如何建構基於區域邊界的 RAG 的範例,請參閱 基於區域邊界的區域鄰接圖 (RAG)。
from skimage import data, segmentation, filters, color
from skimage import graph
from matplotlib import pyplot as plt
def weight_boundary(graph, src, dst, n):
"""
Handle merging of nodes of a region boundary region adjacency graph.
This function computes the `"weight"` and the count `"count"`
attributes of the edge between `n` and the node formed after
merging `src` and `dst`.
Parameters
----------
graph : RAG
The graph under consideration.
src, dst : int
The vertices in `graph` to be merged.
n : int
A neighbor of `src` or `dst` or both.
Returns
-------
data : dict
A dictionary with the "weight" and "count" attributes to be
assigned for the merged node.
"""
default = {'weight': 0.0, 'count': 0}
count_src = graph[src].get(n, default)['count']
count_dst = graph[dst].get(n, default)['count']
weight_src = graph[src].get(n, default)['weight']
weight_dst = graph[dst].get(n, default)['weight']
count = count_src + count_dst
return {
'count': count,
'weight': (count_src * weight_src + count_dst * weight_dst) / count,
}
def merge_boundary(graph, src, dst):
"""Call back called before merging 2 nodes.
In this case we don't need to do any computation here.
"""
pass
img = data.coffee()
edges = filters.sobel(color.rgb2gray(img))
labels = segmentation.slic(img, compactness=30, n_segments=400, start_label=1)
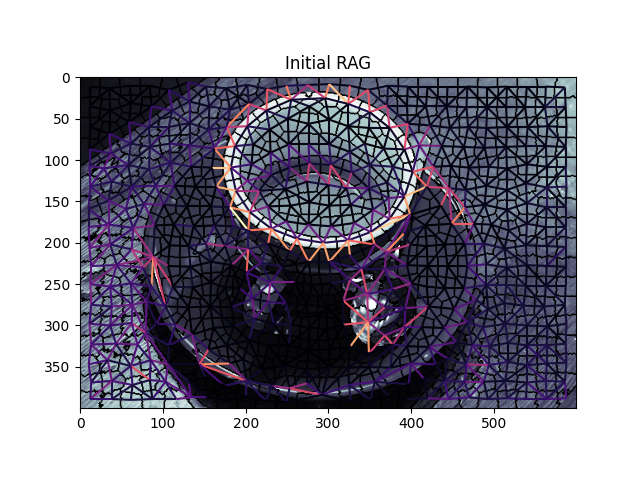
g = graph.rag_boundary(labels, edges)
graph.show_rag(labels, g, img)
plt.title('Initial RAG')
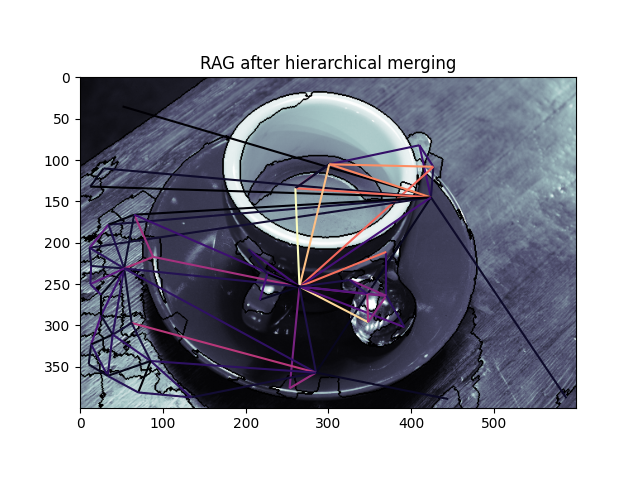
labels2 = graph.merge_hierarchical(
labels,
g,
thresh=0.08,
rag_copy=False,
in_place_merge=True,
merge_func=merge_boundary,
weight_func=weight_boundary,
)
graph.show_rag(labels, g, img)
plt.title('RAG after hierarchical merging')
plt.figure()
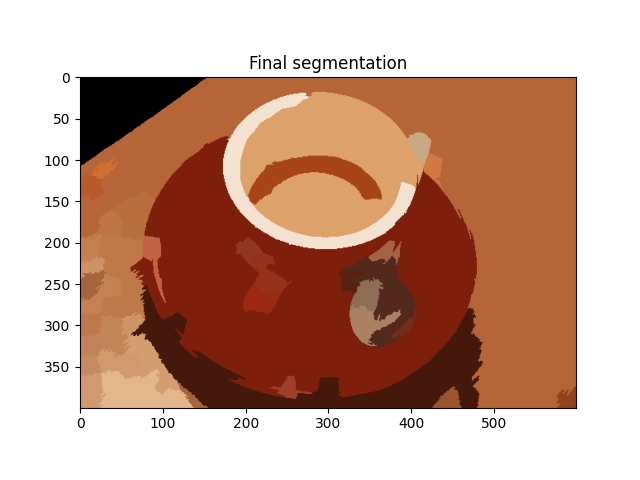
out = color.label2rgb(labels2, img, kind='avg', bg_label=0)
plt.imshow(out)
plt.title('Final segmentation')
plt.show()
腳本的總執行時間:(0 分鐘 1.963 秒)