注意
跳至結尾下載完整的範例程式碼。或透過 Binder 在您的瀏覽器中執行此範例
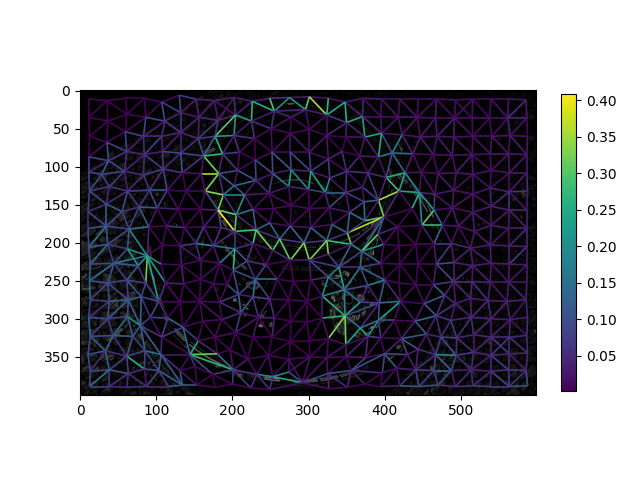
基於區域邊界的區域鄰接圖 (RAGs)#
使用 rag_boundary 函式建構區域邊界 RAG。函式 skimage.graph.rag_boundary() 接受 edge_map 引數,該引數給出每個像素處存在特徵 (例如邊緣) 的顯著性。在區域邊界 RAG 中,兩個區域之間的邊緣權重是 edge_map 中沿著它們共享邊界的對應像素的平均值。
from skimage import graph
from skimage import data, segmentation, color, filters
from matplotlib import pyplot as plt


img = data.coffee()
gimg = color.rgb2gray(img)

labels = segmentation.slic(img, compactness=30, n_segments=400, start_label=1)
edges = filters.sobel(gimg)
edges_rgb = color.gray2rgb(edges)

g = graph.rag_boundary(labels, edges)
lc = graph.show_rag(
    labels, g, edges_rgb, img_cmap=None, edge_cmap='viridis', edge_width=1.2
)

plt.colorbar(lc, fraction=0.03)
plt.show()
腳本的總執行時間: (0 分鐘 1.169 秒)