注意
前往結尾以下載完整的範例程式碼。或透過 Binder 在您的瀏覽器中執行此範例
用於紋理分類的多區塊局部二元模式#
此範例示範如何計算多區塊局部二元模式 (MB-LBP) 特徵,以及如何視覺化它們。
這些特徵的計算方式與局部二元模式 (LBP) 類似,不同之處在於使用總和區塊而不是個別像素值。
MB-LBP 是 LBP 的擴展,可以使用積分影像在恆定時間內以多種尺度計算。使用 9 個大小相等的矩形來計算特徵。對於每個矩形,計算像素強度的總和。將這些總和與中心矩形的總和進行比較,以確定特徵,類似於 LBP(請參閱 LBP)。
首先,我們產生一個影像來說明 MB-LBP 的功能:考慮一個 (9, 9) 矩形,並將其劃分為 (3, 3) 區塊,然後在其上套用 MB-LBP。
from skimage.feature import multiblock_lbp
import numpy as np
from numpy.testing import assert_equal
from skimage.transform import integral_image

# Create test matrix where first and fifth rectangles starting
# from top left clockwise have greater value than the central one.
test_img = np.zeros((9, 9), dtype='uint8')
test_img[3:6, 3:6] = 1
test_img[:3, :3] = 50
test_img[6:, 6:] = 50

# First and fifth bits should be filled. This correct value will
#  be compared to the computed one.
correct_answer = 0b10001000

int_img = integral_image(test_img)

lbp_code = multiblock_lbp(int_img, 0, 0, 3, 3)

assert_equal(correct_answer, lbp_code)
現在,讓我們將運算子套用到真實影像,並看看視覺化如何運作。
from skimage import data
from matplotlib import pyplot as plt
from skimage.feature import draw_multiblock_lbp

test_img = data.coins()

int_img = integral_image(test_img)

lbp_code = multiblock_lbp(int_img, 0, 0, 90, 90)

img = draw_multiblock_lbp(test_img, 0, 0, 90, 90, lbp_code=lbp_code, alpha=0.5)


plt.imshow(img)

plt.show()
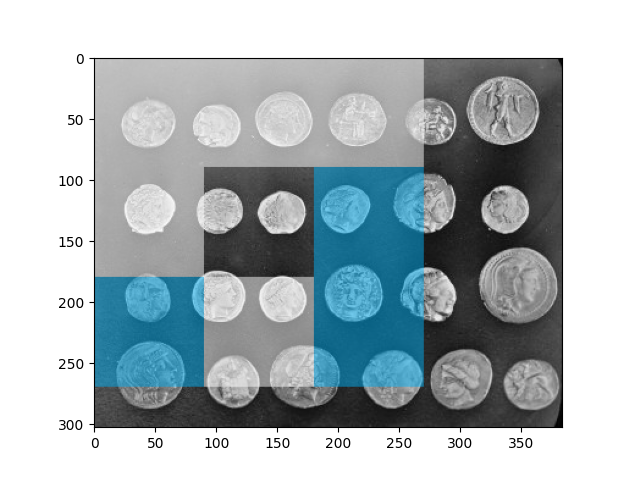
在上面的圖表中,我們看到計算 MB-LBP 的結果,以及計算出的特徵的視覺化。強度總和小於中心矩形的矩形以青色標記。強度值較高的矩形以白色標記。中心矩形保持不變。
腳本的總執行時間: (0 分鐘 0.688 秒)