注意
移至結尾 下載完整的範例程式碼。或透過 Binder 在您的瀏覽器中執行此範例
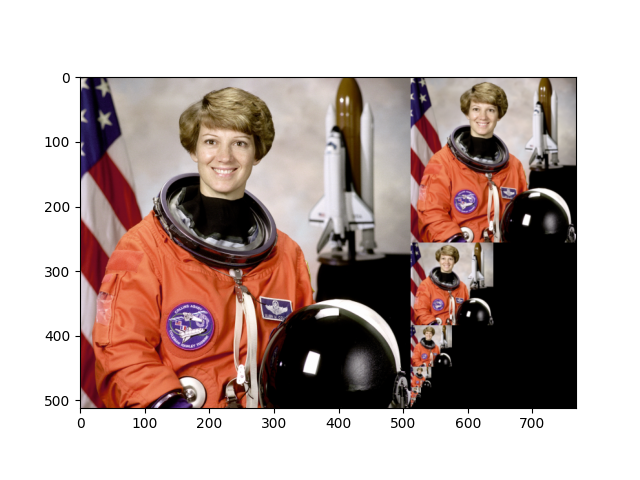
建立影像金字塔#
pyramid_gaussian 函數接受一個影像,並產生連續的影像,這些影像會以恆定的縮放因子縮小。影像金字塔通常用於實作去噪、紋理辨識和尺度不變偵測等演算法。
import numpy as np
import matplotlib.pyplot as plt

from skimage import data
from skimage.transform import pyramid_gaussian


image = data.astronaut()
rows, cols, dim = image.shape
pyramid = tuple(pyramid_gaussian(image, downscale=2, channel_axis=-1))
產生複合影像以進行視覺化#
為了視覺化,我們產生一個複合影像,其列數與來源影像相同,但其欄數為 cols + pyramid[1].shape[1]。然後,我們有空間將所有降採樣影像堆疊在原始影像的右側。
注意:在影像.shape[0] 不是 2 的冪的情況下,金字塔中所有降採樣影像的列數總和有時可能會超過原始影像大小。我們會根據需要稍微擴展複合影像中的列數以解決此問題。為了涵蓋 downscale < 2 的情況,也必須超出原始列數進行擴展。
# determine the total number of rows and columns for the composite
composite_rows = max(rows, sum(p.shape[0] for p in pyramid[1:]))
composite_cols = cols + pyramid[1].shape[1]
composite_image = np.zeros((composite_rows, composite_cols, 3), dtype=np.double)

# store the original to the left
composite_image[:rows, :cols, :] = pyramid[0]

# stack all downsampled images in a column to the right of the original
i_row = 0
for p in pyramid[1:]:
    n_rows, n_cols = p.shape[:2]
    composite_image[i_row : i_row + n_rows, cols : cols + n_cols] = p
    i_row += n_rows

fig, ax = plt.subplots()
ax.imshow(composite_image)
plt.show()
腳本的總執行時間: (0 分鐘 0.471 秒)