注意
前往結尾以下載完整的範例程式碼。或透過 Binder 在您的瀏覽器中執行此範例
區域鄰接圖 (RAGs)#
此範例示範如何使用區域鄰接圖 (RAG) 的 merge_nodes 函式。RAG 類別表示一個無向加權圖,它繼承自 networkx.Graph 類別。當合併兩個節點形成一個新節點時,可以使用使用者定義的函式 weight_func 更新所有入射到結果節點上的邊緣權重。
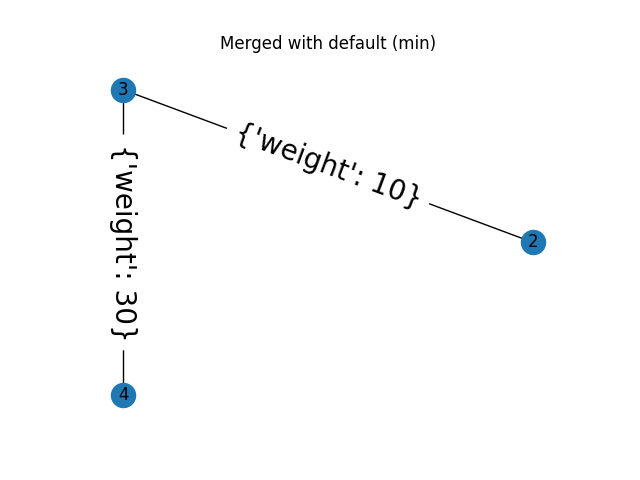
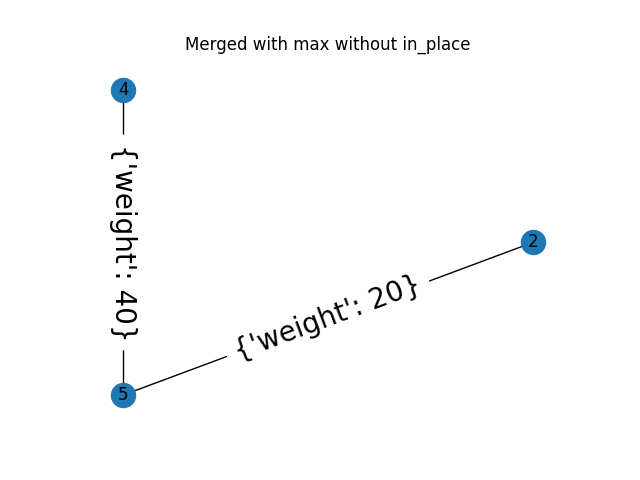
預設行為是在發生衝突時使用較小的邊緣權重。下面的範例還示範如何使用自訂函式來選擇較大的權重。
import skimage as ski
import networkx as nx
from matplotlib import pyplot as plt
import numpy as np
def max_edge(g, src, dst, n):
"""Callback to handle merging nodes by choosing maximum weight.
Returns a dictionary with `"weight"` set as either the weight between
(`src`, `n`) or (`dst`, `n`) in `g` or the maximum of the two when
both exist.
Parameters
----------
g : RAG
The graph under consideration.
src, dst : int
The vertices in `g` to be merged.
n : int
A neighbor of `src` or `dst` or both.
Returns
-------
data : dict
A dict with the "weight" attribute set the weight between
(`src`, `n`) or (`dst`, `n`) in `g` or the maximum of the two when
both exist.
"""
w1 = g[n].get(src, {'weight': -np.inf})['weight']
w2 = g[n].get(dst, {'weight': -np.inf})['weight']
return {'weight': max(w1, w2)}
def display(g, title):
"""Displays a graph with the given title."""
pos = nx.circular_layout(g)
plt.figure()
plt.title(title)
nx.draw(g, pos)
nx.draw_networkx_labels(g, pos)
nx.draw_networkx_edge_labels(g, pos, font_size=20)
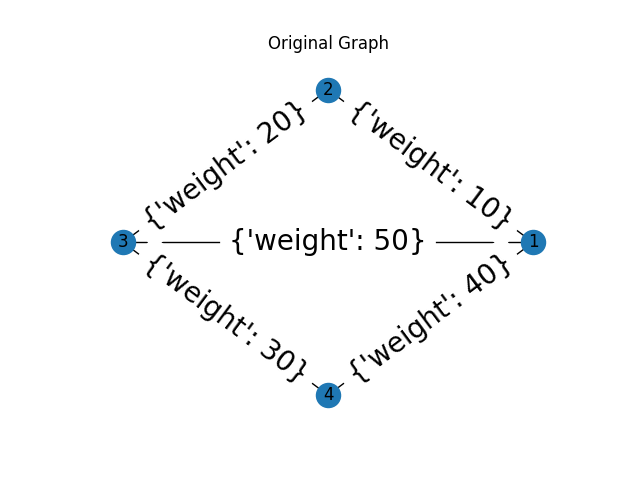
g = ski.graph.RAG()
g.add_edge(1, 2, weight=10)
g.add_edge(2, 3, weight=20)
g.add_edge(3, 4, weight=30)
g.add_edge(4, 1, weight=40)
g.add_edge(1, 3, weight=50)
# Assigning dummy labels.
for n in g.nodes():
g.nodes[n]['labels'] = [n]
gc = g.copy()
display(g, "Original Graph")
g.merge_nodes(1, 3)
display(g, "Merged with default (min)")
gc.merge_nodes(1, 3, weight_func=max_edge, in_place=False)
display(gc, "Merged with max without in_place")
plt.show()
腳本總執行時間:(0 分鐘 0.559 秒)