注意
前往結尾以下載完整的範例程式碼。或透過 Binder 在您的瀏覽器中執行此範例
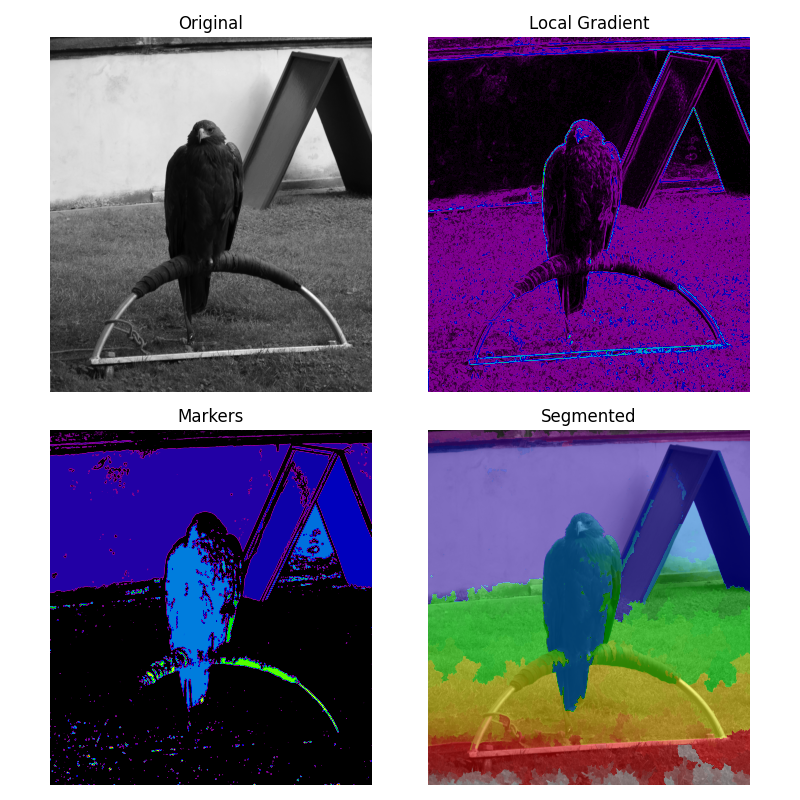
用於分水嶺轉換的標記#
分水嶺是一種用於分割的經典演算法,也就是說,用於分離影像中不同的物件。
這裡,標記影像由影像內低梯度區域建構而成。在梯度影像中,高值區域提供屏障,有助於分割影像。在較低值上使用標記將確保找到分割的物件。
有關演算法的更多詳細資訊,請參閱維基百科。
from scipy import ndimage as ndi
import matplotlib.pyplot as plt

from skimage.morphology import disk
from skimage.segmentation import watershed
from skimage import data
from skimage.filters import rank
from skimage.util import img_as_ubyte


image = img_as_ubyte(data.eagle())

# denoise image
denoised = rank.median(image, disk(2))

# find continuous region (low gradient -
# where less than 10 for this image) --> markers
# disk(5) is used here to get a more smooth image
markers = rank.gradient(denoised, disk(5)) < 10
markers = ndi.label(markers)[0]

# local gradient (disk(2) is used to keep edges thin)
gradient = rank.gradient(denoised, disk(2))

# process the watershed
labels = watershed(gradient, markers)

# display results
fig, axes = plt.subplots(nrows=2, ncols=2, figsize=(8, 8), sharex=True, sharey=True)
ax = axes.ravel()

ax[0].imshow(image, cmap=plt.cm.gray)
ax[0].set_title("Original")

ax[1].imshow(gradient, cmap=plt.cm.nipy_spectral)
ax[1].set_title("Local Gradient")

ax[2].imshow(markers, cmap=plt.cm.nipy_spectral)
ax[2].set_title("Markers")

ax[3].imshow(image, cmap=plt.cm.gray)
ax[3].imshow(labels, cmap=plt.cm.nipy_spectral, alpha=0.5)
ax[3].set_title("Segmented")

for a in ax:
    a.axis('off')

fig.tight_layout()
plt.show()
腳本的總執行時間: (0 分鐘 6.628 秒)