注意
前往結尾下載完整的範例程式碼。或透過 Binder 在您的瀏覽器中執行此範例
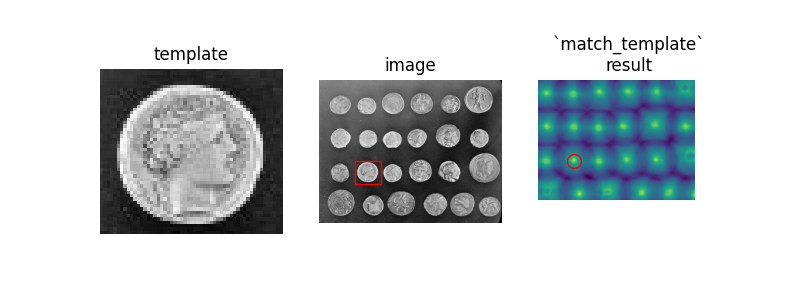
樣板匹配#
我們使用樣板匹配來識別影像區塊的出現(在此例中,是以單一硬幣為中心的子影像)。這裡,我們返回單一匹配項(完全相同的硬幣),因此 match_template 結果中的最大值對應於硬幣的位置。其他硬幣看起來相似,因此具有局部最大值;如果您預期有多個匹配項,則應使用適當的峰值查找函式。
match_template 函式使用快速的歸一化互相關 [1] 來尋找影像中樣板的實例。請注意,match_template 輸出的峰值對應於樣板的原點(即左上角)。
import numpy as np
import matplotlib.pyplot as plt

from skimage import data
from skimage.feature import match_template


image = data.coins()
coin = image[170:220, 75:130]

result = match_template(image, coin)
ij = np.unravel_index(np.argmax(result), result.shape)
x, y = ij[::-1]

fig = plt.figure(figsize=(8, 3))
ax1 = plt.subplot(1, 3, 1)
ax2 = plt.subplot(1, 3, 2)
ax3 = plt.subplot(1, 3, 3, sharex=ax2, sharey=ax2)

ax1.imshow(coin, cmap=plt.cm.gray)
ax1.set_axis_off()
ax1.set_title('template')

ax2.imshow(image, cmap=plt.cm.gray)
ax2.set_axis_off()
ax2.set_title('image')
# highlight matched region
hcoin, wcoin = coin.shape
rect = plt.Rectangle((x, y), wcoin, hcoin, edgecolor='r', facecolor='none')
ax2.add_patch(rect)

ax3.imshow(result)
ax3.set_axis_off()
ax3.set_title('`match_template`\nresult')
# highlight matched region
ax3.autoscale(False)
ax3.plot(x, y, 'o', markeredgecolor='r', markerfacecolor='none', markersize=10)

plt.show()
腳本的總執行時間:(0 分鐘 0.294 秒)