注意
前往結尾下載完整範例程式碼。 或透過 Binder 在您的瀏覽器中執行此範例
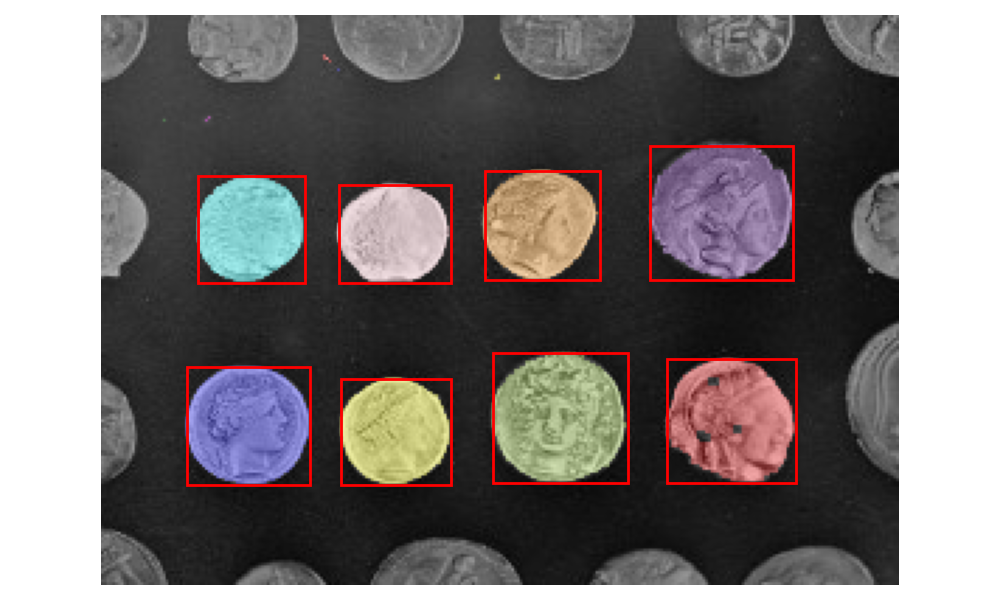
標記影像區域#
此範例示範如何使用影像標記來分割影像。 執行以下步驟
使用自動 Otsu 方法進行閾值處理
使用二元閉合封閉小孔
移除接觸影像邊界的偽影
測量影像區域以過濾小物體
import matplotlib.pyplot as plt
import matplotlib.patches as mpatches

from skimage import data
from skimage.filters import threshold_otsu
from skimage.segmentation import clear_border
from skimage.measure import label, regionprops
from skimage.morphology import closing, footprint_rectangle
from skimage.color import label2rgb


image = data.coins()[50:-50, 50:-50]

# apply threshold
thresh = threshold_otsu(image)
bw = closing(image > thresh, footprint_rectangle((3, 3)))

# remove artifacts connected to image border
cleared = clear_border(bw)

# label image regions
label_image = label(cleared)
# to make the background transparent, pass the value of `bg_label`,
# and leave `bg_color` as `None` and `kind` as `overlay`
image_label_overlay = label2rgb(label_image, image=image, bg_label=0)

fig, ax = plt.subplots(figsize=(10, 6))
ax.imshow(image_label_overlay)

for region in regionprops(label_image):
    # take regions with large enough areas
    if region.area >= 100:
        # draw rectangle around segmented coins
        minr, minc, maxr, maxc = region.bbox
        rect = mpatches.Rectangle(
            (minc, minr),
            maxc - minc,
            maxr - minr,
            fill=False,
            edgecolor='red',
            linewidth=2,
        )
        ax.add_patch(rect)

ax.set_axis_off()
plt.tight_layout()
plt.show()
腳本總執行時間: (0 分鐘 1.709 秒)