注意
移至末尾下載完整的範例程式碼。或透過 Binder 在您的瀏覽器中執行此範例
使用 RANSAC 進行穩健的線模型估計#
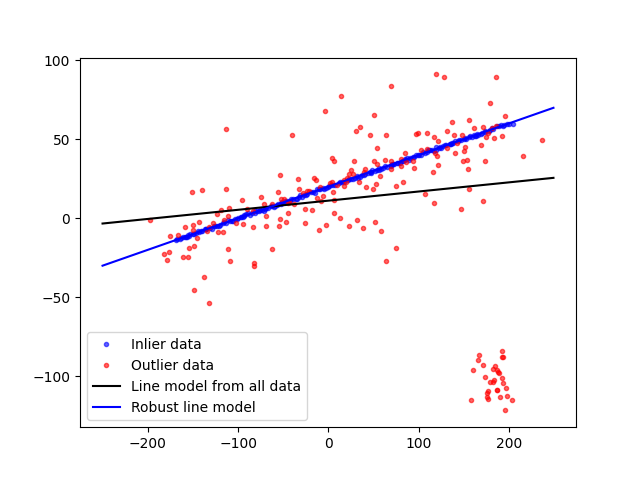
在這個範例中,我們將看到如何使用 RANSAC(隨機樣本共識)演算法,將線模型穩健地擬合到有缺陷的資料。
首先,資料是透過在線性函數中加入高斯雜訊產生的。然後,將離群值點加入資料集中。
RANSAC 反覆從資料集中估計參數。在每次迭代時,都會執行下列步驟
從原始資料中選擇
min_samples個隨機樣本,並檢查資料集是否有效(請參閱is_data_valid選項)。在隨機子集上估計模型(
model_cls.estimate(*data[random_subset]),並檢查估計的模型是否有效(請參閱is_model_valid選項)。透過使用估計的模型計算殘差(
model_cls.residuals(*data))將所有資料點分類為內點或離群值 - 所有殘差小於residual_threshold的資料樣本都會被視為內點。如果內點樣本的數量大於以往,則將估計的模型儲存為最佳模型。如果目前估計的模型具有相同數量的內點,則只有在殘差總和小於的情況下,才會將其視為最佳模型。
這些步驟會執行最大次數,或直到滿足其中一個特殊停止條件為止。最後的模型是使用先前確定的最佳模型的所有內點樣本估計的。
import numpy as np
from matplotlib import pyplot as plt

from skimage.measure import LineModelND, ransac

rng = np.random.default_rng()

# generate coordinates of line
x = np.arange(-200, 200)
y = 0.2 * x + 20
data = np.column_stack([x, y])

# add gaussian noise to coordinates
noise = rng.normal(size=data.shape)
data += 0.5 * noise
data[::2] += 5 * noise[::2]
data[::4] += 20 * noise[::4]

# add faulty data
faulty = np.array(30 * [(180.0, -100)])
faulty += 10 * rng.normal(size=faulty.shape)
data[: faulty.shape[0]] = faulty

# fit line using all data
model = LineModelND()
model.estimate(data)

# robustly fit line only using inlier data with RANSAC algorithm
model_robust, inliers = ransac(
    data, LineModelND, min_samples=2, residual_threshold=1, max_trials=1000
)
outliers = inliers == False

# generate coordinates of estimated models
line_x = np.arange(-250, 250)
line_y = model.predict_y(line_x)
line_y_robust = model_robust.predict_y(line_x)

fig, ax = plt.subplots()
ax.plot(data[inliers, 0], data[inliers, 1], '.b', alpha=0.6, label='Inlier data')
ax.plot(data[outliers, 0], data[outliers, 1], '.r', alpha=0.6, label='Outlier data')
ax.plot(line_x, line_y, '-k', label='Line model from all data')
ax.plot(line_x, line_y_robust, '-b', label='Robust line model')
ax.legend(loc='lower left')
plt.show()
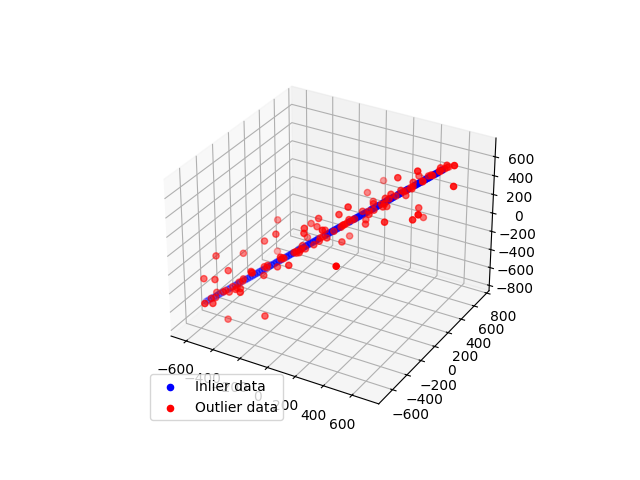
現在,我們將此範例推廣到 3D 點。
import numpy as np
from matplotlib import pyplot as plt
from skimage.measure import LineModelND, ransac


# generate coordinates of line
point = np.array([0, 0, 0], dtype='float')
direction = np.array([1, 1, 1], dtype='float') / np.sqrt(3)
xyz = point + 10 * np.arange(-100, 100)[..., np.newaxis] * direction

# add gaussian noise to coordinates
noise = rng.normal(size=xyz.shape)
xyz += 0.5 * noise
xyz[::2] += 20 * noise[::2]
xyz[::4] += 100 * noise[::4]

# robustly fit line only using inlier data with RANSAC algorithm
model_robust, inliers = ransac(
    xyz, LineModelND, min_samples=2, residual_threshold=1, max_trials=1000
)
outliers = inliers == False

fig = plt.figure()
ax = fig.add_subplot(111, projection='3d')
ax.scatter(
    xyz[inliers][:, 0],
    xyz[inliers][:, 1],
    xyz[inliers][:, 2],
    c='b',
    marker='o',
    label='Inlier data',
)
ax.scatter(
    xyz[outliers][:, 0],
    xyz[outliers][:, 1],
    xyz[outliers][:, 2],
    c='r',
    marker='o',
    label='Outlier data',
)
ax.legend(loc='lower left')
plt.show()
指令碼的總執行時間:(0 分鐘 0.527 秒)