注意
前往結尾下載完整的範例程式碼。或者透過 Binder 在您的瀏覽器中執行此範例
隨機漫步分割#
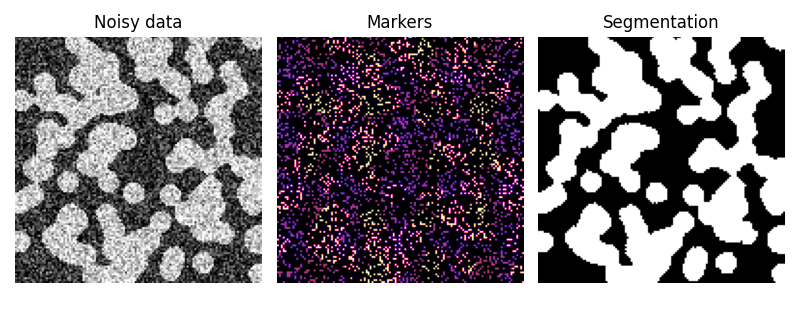
隨機漫步演算法 [1] 從一組標記多個階段(2 個或更多)的標記來確定影像的分割。使用在標記位置初始化的追蹤器,求解各向異性擴散方程。如果相鄰像素具有相似的值,則局部擴散係數較大,因此擴散難以跨越高梯度。每個未知像素的標籤歸因於在該擴散過程中首先到達的可能性最高的已知標記的標籤。
在此範例中,可以清楚地看到兩個階段,但數據太過雜訊,無法僅從直方圖執行分割。我們從灰度值直方圖的極端尾部確定這兩個階段的標記,並使用隨機漫步進行分割。
import numpy as np
import matplotlib.pyplot as plt

from skimage.segmentation import random_walker
from skimage.data import binary_blobs
from skimage.exposure import rescale_intensity
import skimage

rng = np.random.default_rng()

# Generate noisy synthetic data
data = skimage.img_as_float(binary_blobs(length=128, rng=1))
sigma = 0.35
data += rng.normal(loc=0, scale=sigma, size=data.shape)
data = rescale_intensity(data, in_range=(-sigma, 1 + sigma), out_range=(-1, 1))

# The range of the binary image spans over (-1, 1).
# We choose the hottest and the coldest pixels as markers.
markers = np.zeros(data.shape, dtype=np.uint)
markers[data < -0.95] = 1
markers[data > 0.95] = 2

# Run random walker algorithm
labels = random_walker(data, markers, beta=10, mode='bf')

# Plot results
fig, (ax1, ax2, ax3) = plt.subplots(1, 3, figsize=(8, 3.2), sharex=True, sharey=True)
ax1.imshow(data, cmap='gray')
ax1.axis('off')
ax1.set_title('Noisy data')
ax2.imshow(markers, cmap='magma')
ax2.axis('off')
ax2.set_title('Markers')
ax3.imshow(labels, cmap='gray')
ax3.axis('off')
ax3.set_title('Segmentation')

fig.tight_layout()
plt.show()
腳本總執行時間: (0 分鐘 0.559 秒)