注意
跳到結尾下載完整的範例程式碼。或透過 Binder 在您的瀏覽器中執行此範例
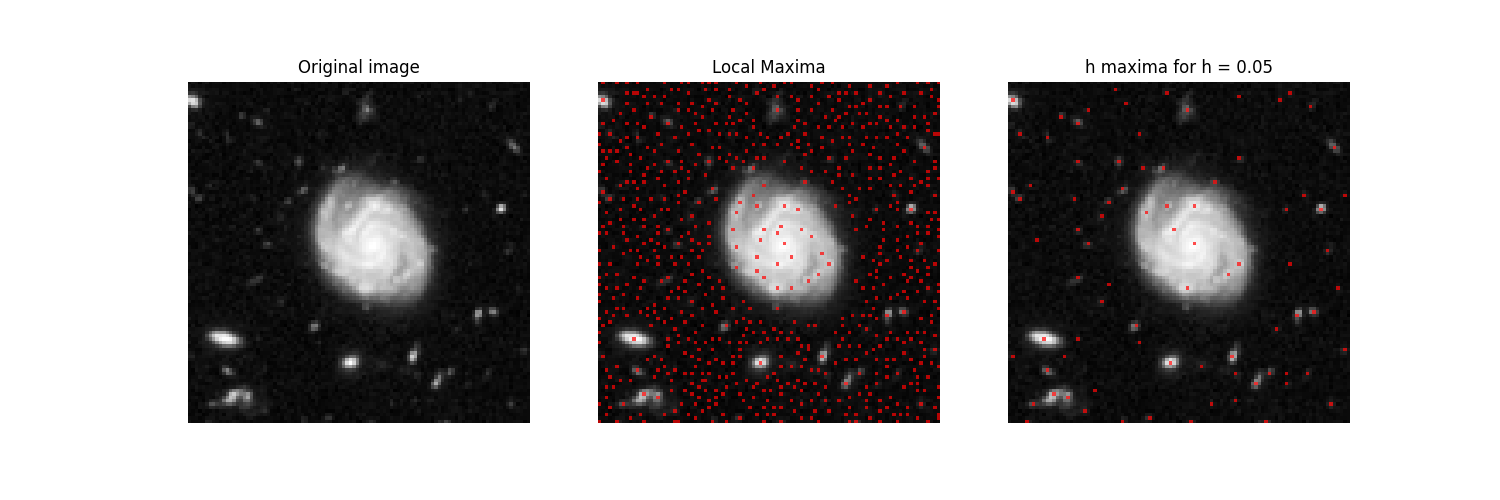
極值#
我們偵測星系影像中的局部最大值。影像受到雜訊干擾,產生許多局部最大值。為了只保留具有足夠局部對比度的最大值,我們使用 h-最大值。
import matplotlib.pyplot as plt

from skimage.measure import label
from skimage import data
from skimage import color
from skimage.morphology import extrema
from skimage import exposure


color_image = data.hubble_deep_field()

# for illustration purposes, we work on a crop of the image.
x_0 = 70
y_0 = 354
width = 100
height = 100

img = color.rgb2gray(color_image)[y_0 : (y_0 + height), x_0 : (x_0 + width)]

# the rescaling is done only for visualization purpose.
# the algorithms would work identically in an unscaled version of the
# image. However, the parameter h needs to be adapted to the scale.
img = exposure.rescale_intensity(img)
最大值偵測
# Maxima in the galaxy image are detected by mathematical morphology.
# There is no a priori constraint on the density.

# We find all local maxima
local_maxima = extrema.local_maxima(img)
label_maxima = label(local_maxima)
overlay = color.label2rgb(
    label_maxima, img, alpha=0.7, bg_label=0, bg_color=None, colors=[(1, 0, 0)]
)

# We observed in the previous image, that there are many local maxima
# that are caused by the noise in the image.
# For this, we find all local maxima with a height of h.
# This height is the gray level value by which we need to descent
# in order to reach a higher maximum and it can be seen as a local
# contrast measurement.
# The value of h scales with the dynamic range of the image, i.e.
# if we multiply the image with a constant, we need to multiply
# the value of h with the same constant in order to achieve the same result.
h = 0.05
h_maxima = extrema.h_maxima(img, h)
label_h_maxima = label(h_maxima)
overlay_h = color.label2rgb(
    label_h_maxima, img, alpha=0.7, bg_label=0, bg_color=None, colors=[(1, 0, 0)]
)
圖形輸出
# a new figure with 3 subplots
fig, ax = plt.subplots(1, 3, figsize=(15, 5))

ax[0].imshow(img, cmap='gray')
ax[0].set_title('Original image')
ax[0].axis('off')

ax[1].imshow(overlay)
ax[1].set_title('Local Maxima')
ax[1].axis('off')

ax[2].imshow(overlay_h)
ax[2].set_title(f'h maxima for h = {h:.2f}')
ax[2].axis('off')
plt.show()
腳本的總執行時間:(0 分鐘 0.358 秒)