注意
前往結尾以下載完整的範例程式碼。或透過 Binder 在您的瀏覽器中執行此範例
閾值處理#
閾值處理用於從灰階影像建立二元影像 [1]。
另請參閱
關於 閾值處理 更全面的介紹
import matplotlib.pyplot as plt
from skimage import data
from skimage.filters import threshold_otsu
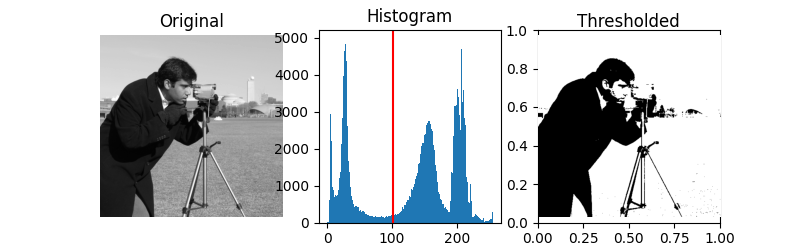
我們說明如何應用其中一個閾值處理演算法。Otsu 的方法 [2] 計算「最佳」閾值(在下面的直方圖中以紅線標示),方法是最大化由閾值分隔的兩個像素類別之間的變異數。等效地,此閾值會最小化類內變異數。
image = data.camera()
thresh = threshold_otsu(image)
binary = image > thresh

fig, axes = plt.subplots(ncols=3, figsize=(8, 2.5))
ax = axes.ravel()
ax[0] = plt.subplot(1, 3, 1)
ax[1] = plt.subplot(1, 3, 2)
ax[2] = plt.subplot(1, 3, 3, sharex=ax[0], sharey=ax[0])

ax[0].imshow(image, cmap=plt.cm.gray)
ax[0].set_title('Original')
ax[0].axis('off')

ax[1].hist(image.ravel(), bins=256)
ax[1].set_title('Histogram')
ax[1].axvline(thresh, color='r')

ax[2].imshow(binary, cmap=plt.cm.gray)
ax[2].set_title('Thresholded')
ax[2].axis('off')

plt.show()
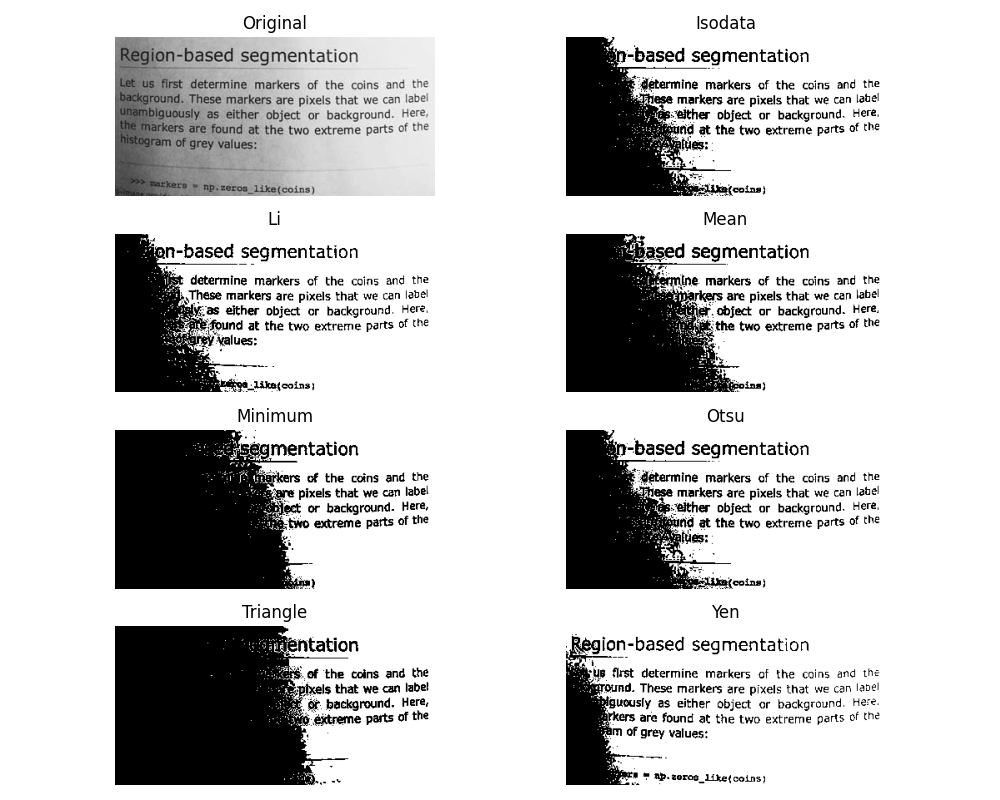
如果您不熟悉不同演算法和基本假設的細節,通常很難知道哪個演算法會產生最佳結果。因此,Scikit-image 包含一個函數來評估函式庫提供的閾值處理演算法。只需一瞥,您就可以為您的資料選擇最佳演算法,而無需深入了解其機制。
from skimage.filters import try_all_threshold

img = data.page()

fig, ax = try_all_threshold(img, figsize=(10, 8), verbose=False)
plt.show()
腳本的總執行時間:(0 分鐘 1.554 秒)