注意
前往末尾下載完整的範例程式碼。或透過 Binder 在您的瀏覽器中執行此範例
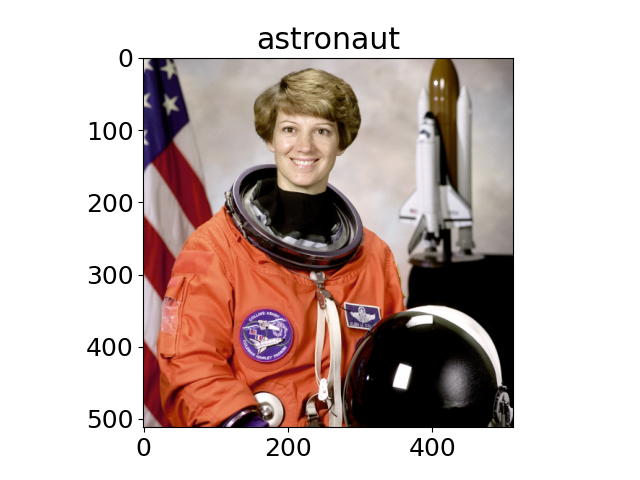
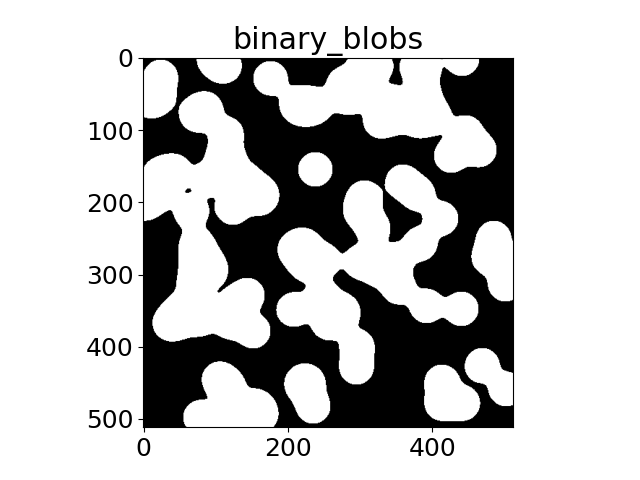
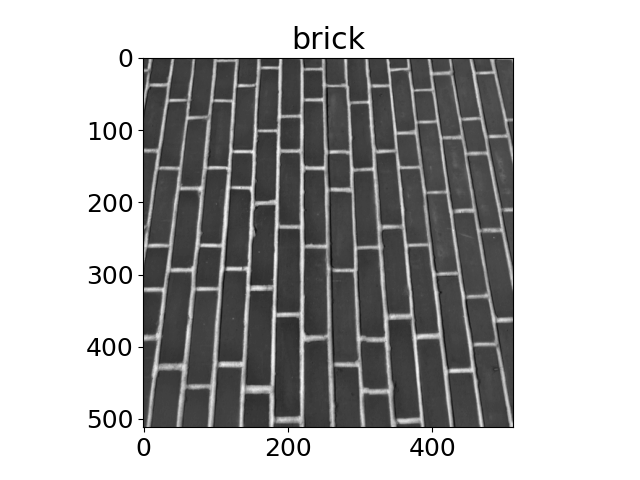
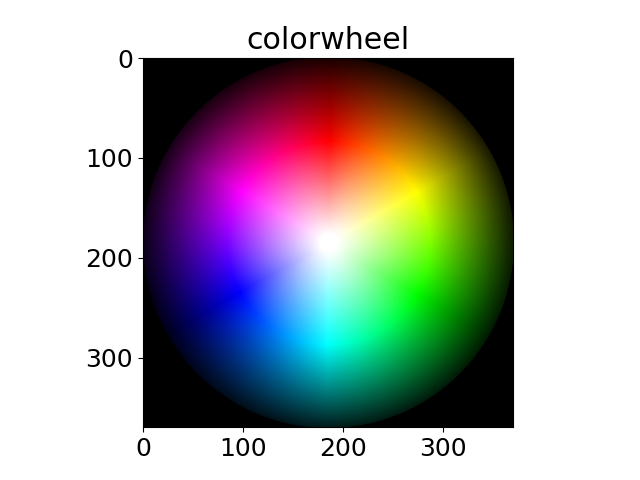
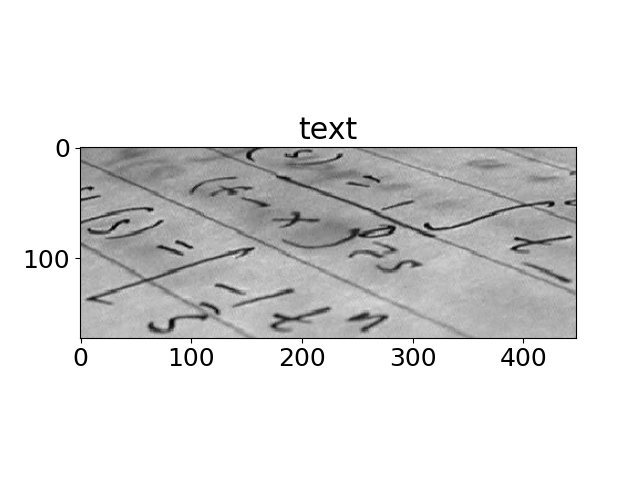
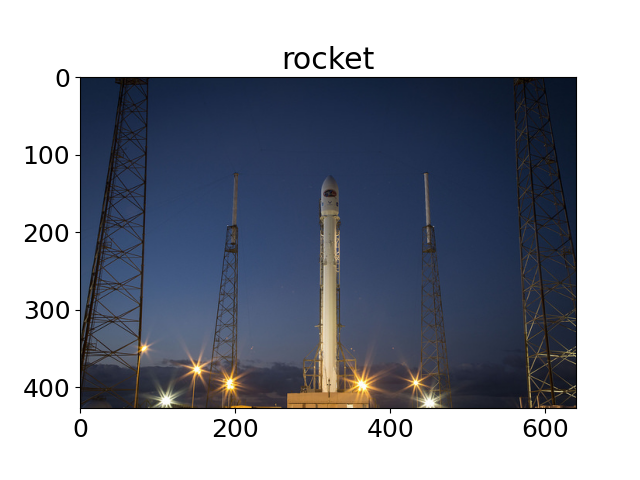
通用影像#
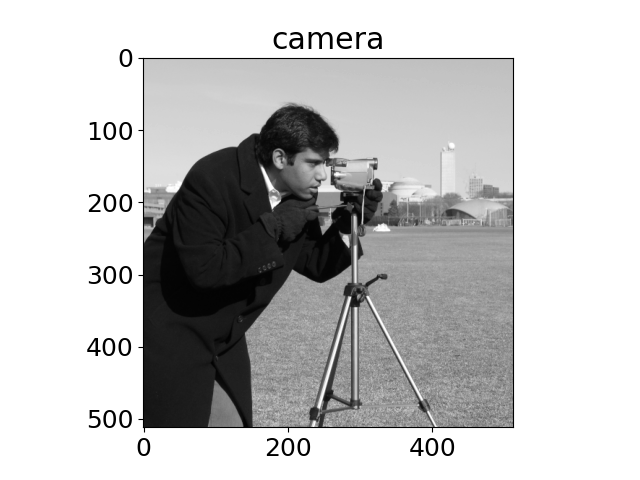
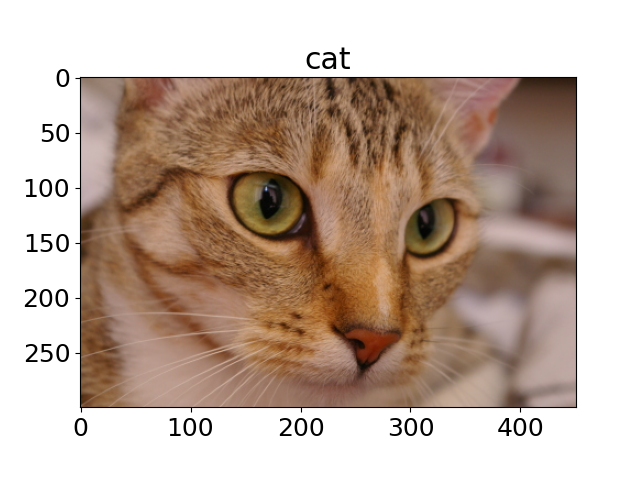
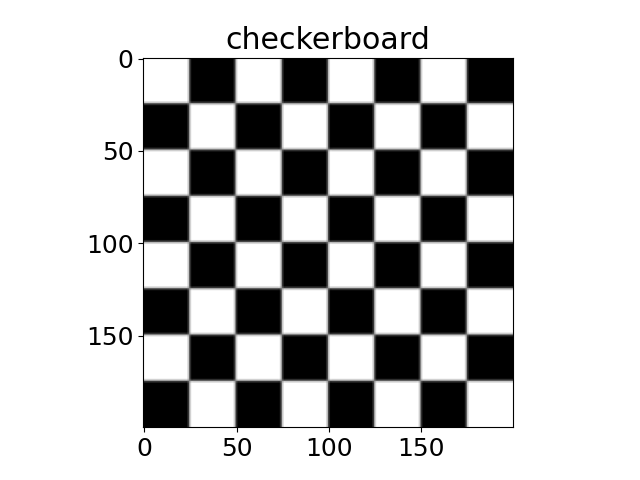
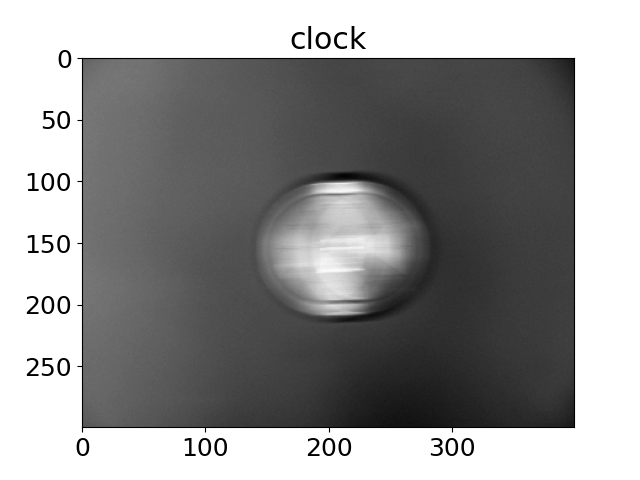
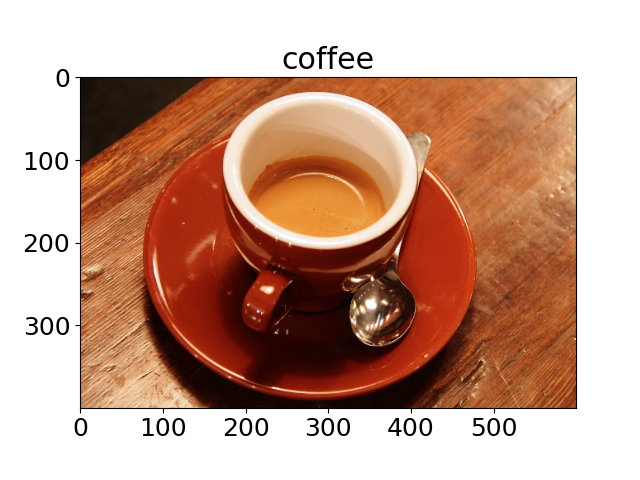
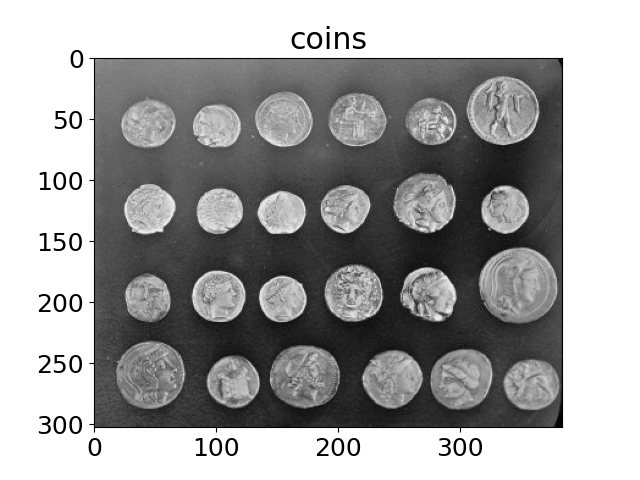
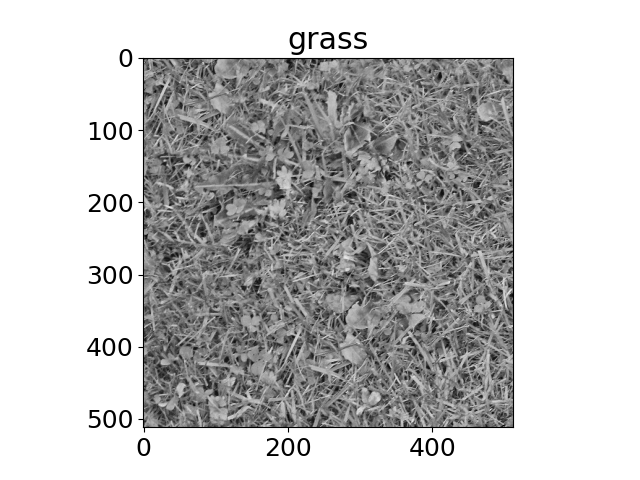
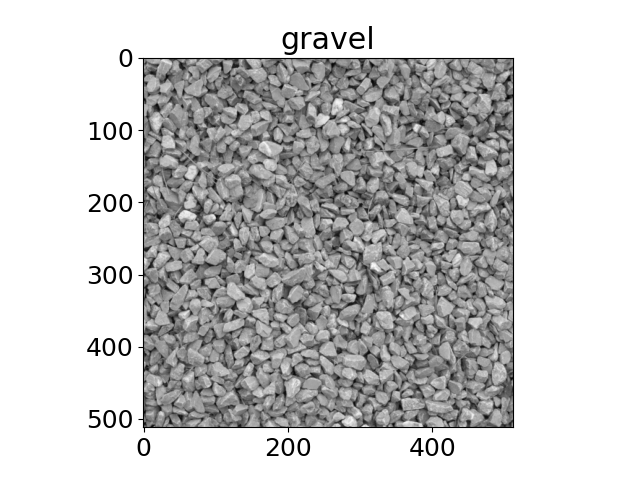
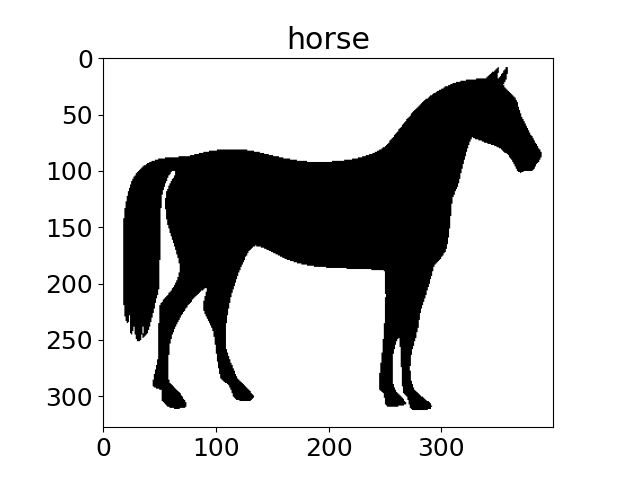
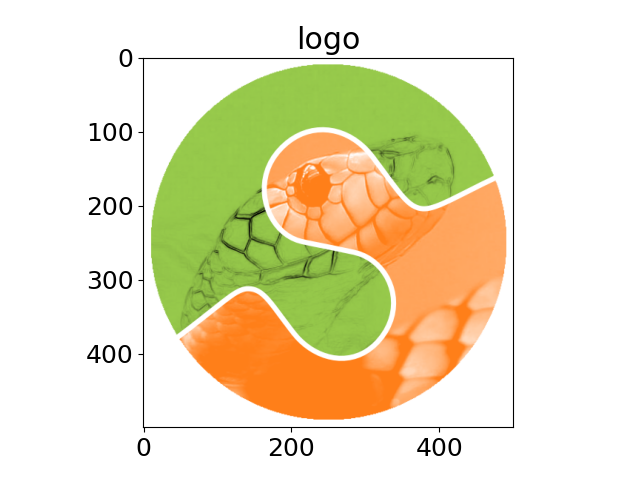
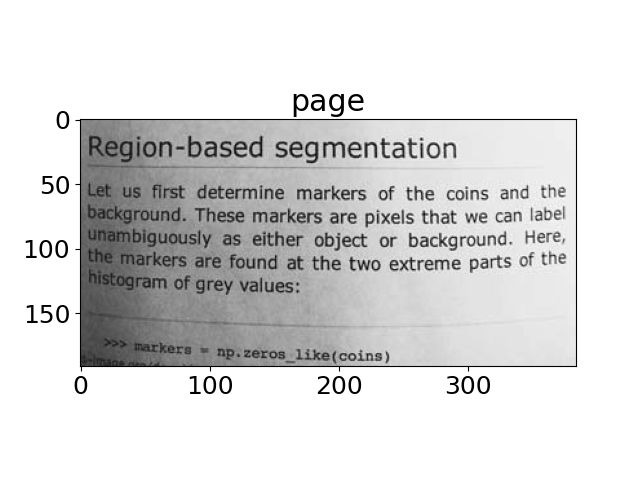
每個影像的標題都指示函數的名稱。
import matplotlib.pyplot as plt
import matplotlib
import numpy as np

from skimage import data

matplotlib.rcParams['font.size'] = 18

images = (
    'astronaut',
    'binary_blobs',
    'brick',
    'colorwheel',
    'camera',
    'cat',
    'checkerboard',
    'clock',
    'coffee',
    'coins',
    'eagle',
    'grass',
    'gravel',
    'horse',
    'logo',
    'page',
    'text',
    'rocket',
)


for name in images:
    caller = getattr(data, name)
    image = caller()
    plt.figure()
    plt.title(name)
    if image.ndim == 2:
        plt.imshow(image, cmap=plt.cm.gray)
    else:
        plt.imshow(image)

plt.show()
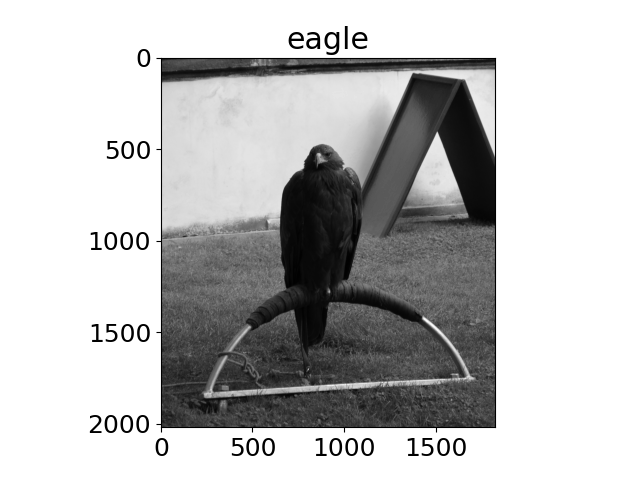
Downloading file 'data/eagle.png' from 'https://gitlab.com/scikit-image/data/-/raw/1e4f62ac31ba4553d176d4473a5967ad1b076d62/eagle.png' to '/home/runner/.cache/scikit-image/0.25.0'.
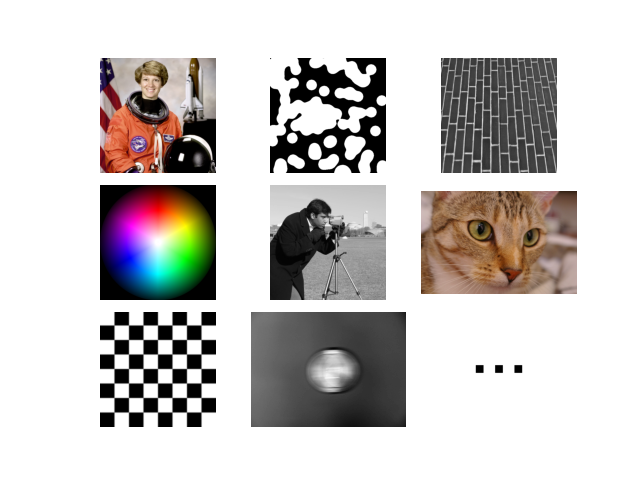
圖庫的縮圖影像
fig, axs = plt.subplots(nrows=3, ncols=3)
for ax in axs.flat:
    ax.axis("off")
axs[0, 0].imshow(data.astronaut())
axs[0, 1].imshow(data.binary_blobs(), cmap=plt.cm.gray)
axs[0, 2].imshow(data.brick(), cmap=plt.cm.gray)
axs[1, 0].imshow(data.colorwheel())
axs[1, 1].imshow(data.camera(), cmap=plt.cm.gray)
axs[1, 2].imshow(data.cat())
axs[2, 0].imshow(data.checkerboard(), cmap=plt.cm.gray)
axs[2, 1].imshow(data.clock(), cmap=plt.cm.gray)
further_img = np.full((300, 300), 255)
for xpos in [100, 150, 200]:
    further_img[150 - 10 : 150 + 10, xpos - 10 : xpos + 10] = 0
axs[2, 2].imshow(further_img, cmap=plt.cm.gray)
plt.subplots_adjust(wspace=0.1, hspace=0.1)
腳本的總執行時間: (0 分鐘 6.378 秒)