注意
前往結尾下載完整範例程式碼。或透過 Binder 在您的瀏覽器中執行此範例
巴特沃斯濾波器#
巴特沃斯濾波器在頻域中實現,其設計為沒有通帶或阻帶波紋。它可以作為低通或高通變體使用。cutoff_frequency_ratio 參數用於設定截止頻率,為取樣頻率的分數。鑑於奈奎斯特頻率是取樣頻率的一半,這表示此參數應為 < 0.5 的正浮點數。order 濾波器的階數可以調整以控制過渡寬度,較高的值會導致通帶和阻帶之間更銳利的過渡。
巴特沃斯濾波範例#
在這裡,我們定義一個 get_filtered 輔助函式,以在指定的截止頻率系列重複低通和高通濾波。
import matplotlib.pyplot as plt

from skimage import data, filters

image = data.camera()

# cutoff frequencies as a fraction of the maximum frequency
cutoffs = [0.02, 0.08, 0.16]


def get_filtered(image, cutoffs, squared_butterworth=True, order=3.0, npad=0):
    """Lowpass and highpass butterworth filtering at all specified cutoffs.

    Parameters
    ----------
    image : ndarray
        The image to be filtered.
    cutoffs : sequence of int
        Both lowpass and highpass filtering will be performed for each cutoff
        frequency in `cutoffs`.
    squared_butterworth : bool, optional
        Whether the traditional Butterworth filter or its square is used.
    order : float, optional
        The order of the Butterworth filter

    Returns
    -------
    lowpass_filtered : list of ndarray
        List of images lowpass filtered at the frequencies in `cutoffs`.
    highpass_filtered : list of ndarray
        List of images highpass filtered at the frequencies in `cutoffs`.
    """

    lowpass_filtered = []
    highpass_filtered = []
    for cutoff in cutoffs:
        lowpass_filtered.append(
            filters.butterworth(
                image,
                cutoff_frequency_ratio=cutoff,
                order=order,
                high_pass=False,
                squared_butterworth=squared_butterworth,
                npad=npad,
            )
        )
        highpass_filtered.append(
            filters.butterworth(
                image,
                cutoff_frequency_ratio=cutoff,
                order=order,
                high_pass=True,
                squared_butterworth=squared_butterworth,
                npad=npad,
            )
        )
    return lowpass_filtered, highpass_filtered


def plot_filtered(lowpass_filtered, highpass_filtered, cutoffs):
    """Generate plots for paired lists of lowpass and highpass images."""
    fig, axes = plt.subplots(2, 1 + len(cutoffs), figsize=(12, 8))
    fontdict = dict(fontsize=14, fontweight='bold')

    axes[0, 0].imshow(image, cmap='gray')
    axes[0, 0].set_title('original', fontdict=fontdict)
    axes[1, 0].set_axis_off()

    for i, c in enumerate(cutoffs):
        axes[0, i + 1].imshow(lowpass_filtered[i], cmap='gray')
        axes[0, i + 1].set_title(f'lowpass, c={c}', fontdict=fontdict)
        axes[1, i + 1].imshow(highpass_filtered[i], cmap='gray')
        axes[1, i + 1].set_title(f'highpass, c={c}', fontdict=fontdict)

    for ax in axes.ravel():
        ax.set_xticks([])
        ax.set_yticks([])
    plt.tight_layout()
    return fig, axes


# Perform filtering with the (squared) Butterworth filter at a range of
# cutoffs.
lowpasses, highpasses = get_filtered(image, cutoffs, squared_butterworth=True)

fig, axes = plot_filtered(lowpasses, highpasses, cutoffs)
titledict = dict(fontsize=18, fontweight='bold')
fig.text(
    0.5,
    0.95,
    '(squared) Butterworth filtering (order=3.0, npad=0)',
    fontdict=titledict,
    horizontalalignment='center',
)

Text(0.5, 0.95, '(squared) Butterworth filtering (order=3.0, npad=0)')
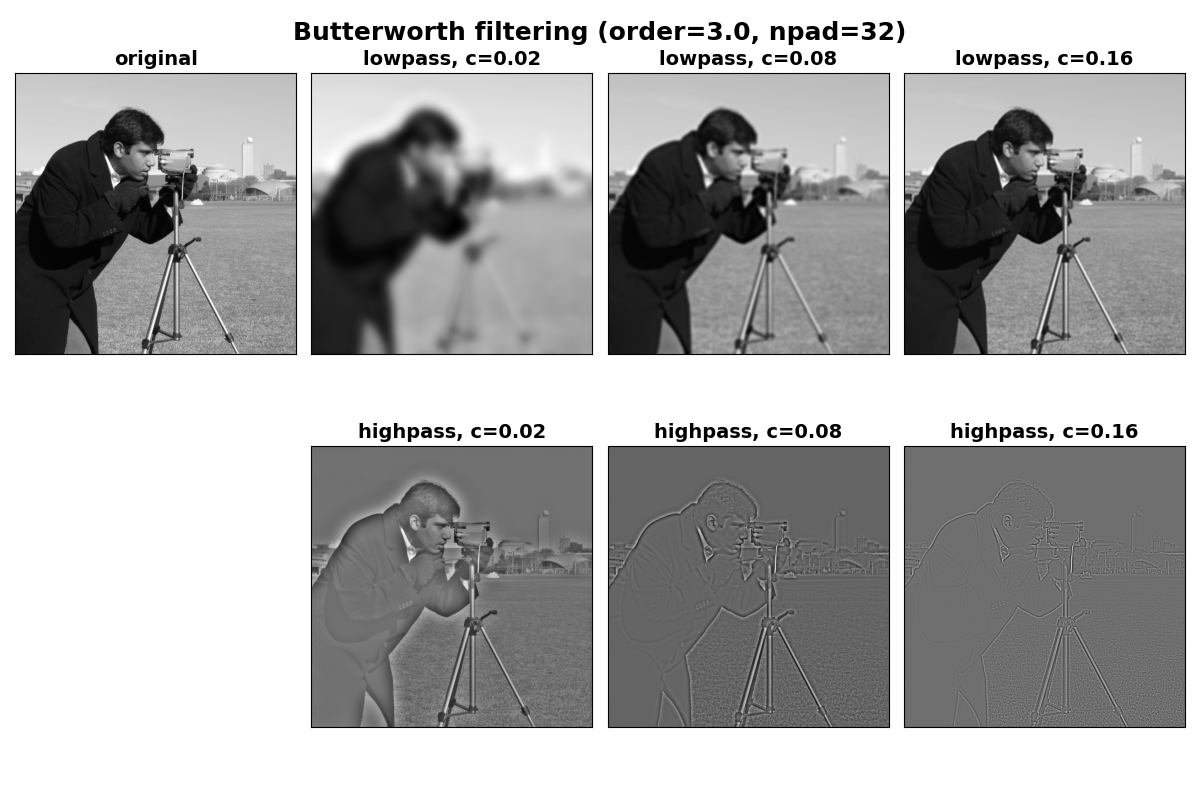
避免邊界偽影#
在上面的影像中可以看到,影像邊緣附近存在偽影(尤其是對於較小的截止值)。這是由於 DFT 的週期性性質所致,並且可以透過在濾波之前對邊緣應用一定量的填充來減少,以便影像的週期性擴展中沒有銳利的邊緣。這可以透過 butterworth 的 npad 引數完成。
請注意,透過填充,影像邊緣處不必要的陰影會大幅減少。
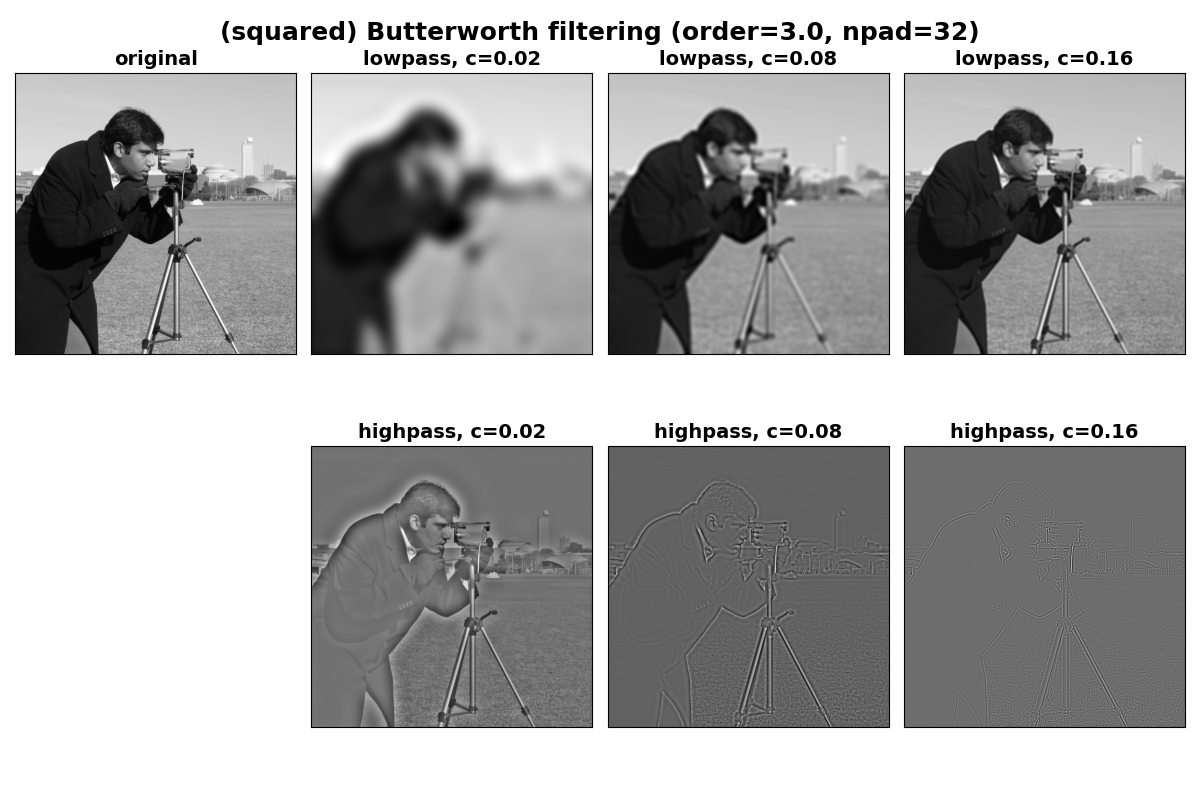
Text(0.5, 0.95, '(squared) Butterworth filtering (order=3.0, npad=32)')
真實巴特沃斯濾波器#
要使用巴特沃斯濾波器的傳統訊號處理定義,請設定 squared_butterworth=False。此變體的頻域振幅輪廓是預設情況的平方根。這會導致從通帶到阻帶的過渡在任何給定 order 時都更加漸進。這可以在以下影像中看到,這些影像在低通情況下看起來比上面的平方巴特沃斯對應物更清晰一些。
腳本總執行時間: (0 分鐘 3.383 秒)