注意
前往結尾下載完整範例程式碼。或透過 Binder 在您的瀏覽器中執行此範例
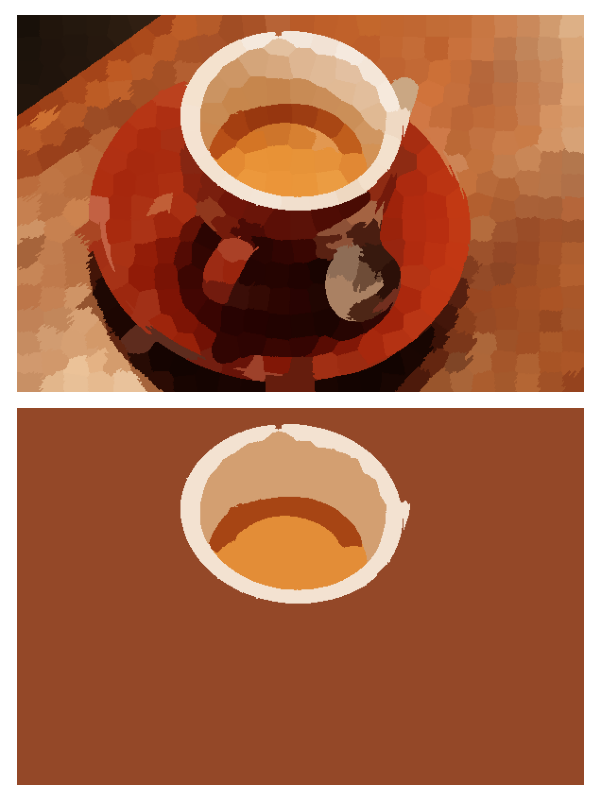
正規化切割#
此範例會建構一個區域鄰接圖 (RAG),並在其上遞迴執行正規化切割 [1]。
參考文獻#
from skimage import data, segmentation, color
from skimage import graph
from matplotlib import pyplot as plt


img = data.coffee()

labels1 = segmentation.slic(img, compactness=30, n_segments=400, start_label=1)
out1 = color.label2rgb(labels1, img, kind='avg', bg_label=0)

g = graph.rag_mean_color(img, labels1, mode='similarity')
labels2 = graph.cut_normalized(labels1, g)
out2 = color.label2rgb(labels2, img, kind='avg', bg_label=0)

fig, ax = plt.subplots(nrows=2, sharex=True, sharey=True, figsize=(6, 8))

ax[0].imshow(out1)
ax[1].imshow(out2)

for a in ax:
    a.axis('off')

plt.tight_layout()
腳本總執行時間: (0 分鐘 3.866 秒)