注意
跳至結尾以下載完整的範例程式碼。或透過 Binder 在您的瀏覽器中執行此範例
使用薄板樣條進行影像扭曲#
為了扭曲影像,我們先從一組來源和目標座標開始。目標是扭曲影像,使來源點移動到目標位置。通常,我們只知道少數選定來源點的目標位置。為了計算所有其他像素位置的目標位置,我們需要一個模型。存在各種此類模型,例如仿射或投影變換。
大多數變換都是線性的(也就是說,它們會保留直線),但有時我們需要更大的彈性。一種表示非線性變換的模型,即線條可以彎曲的模型,是薄板樣條[1] [2]。
薄板樣條是利用金屬板的類比,金屬板具有固有的剛性。考慮我們的來源點:每個點都必須在 x 和 y 方向上移動一定距離,才能到達其對應的目標位置。首先,僅檢查 x 座標。想像一下將一塊薄金屬板放置在影像上方。現在彎曲它,使在每個來源點,板的 z 偏移量是該來源點必須在 x 方向上行進才能到達其目標位置的距離,正或負。板會抵抗彎曲,因此保持平滑。我們可以從板的位置讀取來源點以外的座標的偏移量。可以對 y 座標重複相同的程序。
這給了我們薄板樣條模型,該模型將任何 (x, y) 座標對應到目標位置。
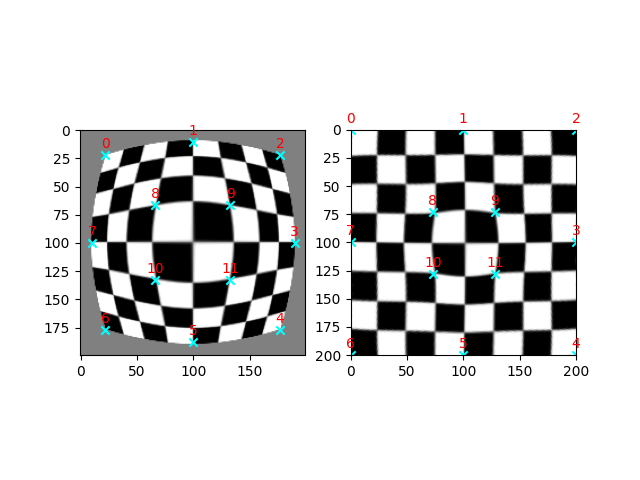
校正桶狀失真#
在本範例中,我們示範如何使用薄板樣條變換來校正桶狀失真[3]。桶狀失真會產生典型的魚眼效果,其中影像放大倍率會隨著與影像中心距離的增加而減少。
我們首先產生一個範例資料集,方法是對棋盤影像套用魚眼扭曲,然後套用反向校正變換。
import matplotlib.pyplot as plt
import numpy as np

import skimage as ski


def radial_distortion(xy, k1=0.9, k2=0.5):
    """Distort coordinates `xy` symmetrically around their own center."""
    xy_c = xy.max(axis=0) / 2
    xy = (xy - xy_c) / xy_c
    radius = np.linalg.norm(xy, axis=1)
    distortion_model = (1 + k1 * radius + k2 * radius**2) * k2
    xy *= distortion_model.reshape(-1, 1)
    xy = xy * xy_c + xy_c
    return xy


image = ski.data.checkerboard()
image = ski.transform.warp(image, radial_distortion, cval=0.5)


# Pick a few `src` points by hand, and move the corresponding `dst` points to their
# expected positions.
# fmt: off
src = np.array([[22,  22], [100,  10], [177, 22], [190, 100], [177, 177], [100, 188],
                [22, 177], [ 10, 100], [ 66, 66], [133,  66], [ 66, 133], [133, 133]])
dst = np.array([[ 0,   0], [100,   0], [200,  0], [200, 100], [200, 200], [100, 200],
                [ 0, 200], [  0, 100], [ 73, 73], [128,  73], [ 73, 128], [128, 128]])
# fmt: on

# Estimate the TPS transformation from these points and then warp the image.
# We switch `src` and `dst` here because `skimage.transform.warp` requires the
# inverse transformation!
tps = ski.transform.ThinPlateSplineTransform()
tps.estimate(dst, src)
warped = ski.transform.warp(image, tps)


# Plot the results
fig, axs = plt.subplots(1, 2)
axs[0].imshow(image, cmap='gray')
axs[0].scatter(src[:, 0], src[:, 1], marker='x', color='cyan')
axs[1].imshow(warped, cmap='gray', extent=(0, 200, 200, 0))
axs[1].scatter(dst[:, 0], dst[:, 1], marker='x', color='cyan')

point_labels = [str(i) for i in range(len(src))]
for i, label in enumerate(point_labels):
    axs[0].annotate(
        label,
        (src[:, 0][i], src[:, 1][i]),
        textcoords="offset points",
        xytext=(0, 5),
        ha='center',
        color='red',
    )
    axs[1].annotate(
        label,
        (dst[:, 0][i], dst[:, 1][i]),
        textcoords="offset points",
        xytext=(0, 5),
        ha='center',
        color='red',
    )

plt.show()
腳本的總執行時間: (0 分鐘 0.309 秒)